The US Dollar Index (DXY) is an index of the value of the US dollar relative to a basket of foreign currencies. The index itself is tradable on the Intercontinental Exchange Inc (NYSE:ICE) Futures exchanges and is available as an ETF but this means for most currency traders it’s off limits, meaning your forex broker probably doesn’t offer the instrument. However, this shouldn’t take away from its importance or the potential for you to trade it by allocating a percentage of your funds for buying/selling USD pairs in correlation to the index’s allocation. The allocation is as follows:
- Euro (EUR), 57.6% weight
- Japanese yen (JPY) 13.6% weight
- Pound sterling (GBP), 11.9% weight
- Canadian dollar (CAD), 9.1% weight
- Swedish krona (SEK), 4.2% weight
- Swiss franc (CHF) 3.6% weight
The US Dollar Index originally was developed by the US Federal Reserve in 1973 to provide an external bilateral trade-weighted average value of the US dollar as it freely floated against global currencies. The index composition is ripe for revision as the allocation was initially calculated based on the volume of USD exchanged for global currencies. However, with economies rising and falling, the dollar basket should be composed of other currencies such as the Aussie dollar and the Chinese Yuan. Nevertheless, the DXY is considered the benchmark by which to judge US dollar weakness or strength. If a trader generally thought the USD will strengthen or weaken and wanted to speculate by taking a position for or against it, buying or selling pairs according to the allocation above is an ideal way to diversify a risky proposition.
The DXY is useful if a trader wishes to enter or exit a position or buy or sell the USD against any specific currency. For example, if the Australian dollar is consolidating against the USD (demonstrating a degree of inertia) but the EUR/USD is showing strong appreciating momentum along with the DXY, then it could be assessed that the AUD will soon continue to appreciate against the USD and that the current inertia is transient. In this case buying the AUD is worthwhile as US dollar weakness is assessed to be the real driver.
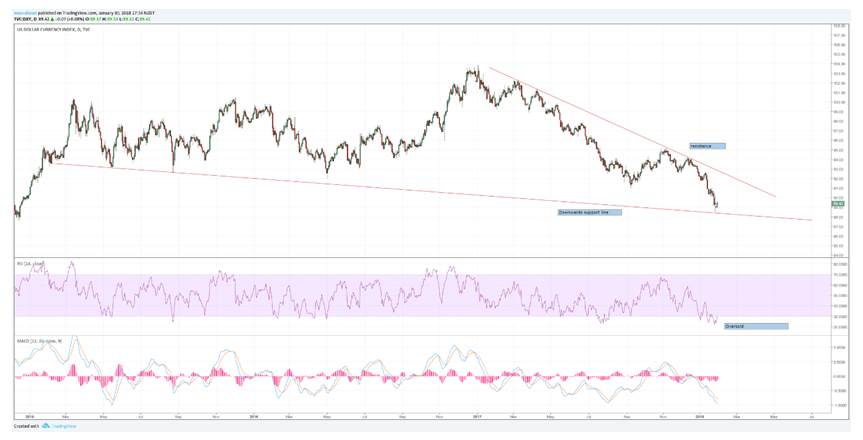
Another way the DXY is useful to traders is through a technical analysis of its chart. For example, if the DXY has fallen (the US dollar has depreciated) to a level of technical support, then this could be a good method to ascertain a level at which to go long on the greenback, especially if an oversold indicator confirms this. Let’s look at the chart below. The price has fallen to a level of support going back to March 2015. Secondly, the RSI indicator tells us the price is now over oversold. The MACD is also deeply bearish. At this level, in the context of a tightening monetary policy, I’d say the US dollar might be ready to retrace after a prolonged period of bearishness. On the other hand, you could argue the USD is just taking a breather before falling further and therefore, any long position should also incorporate stop loss orders below the indicated support level.

