What a non-surprise from the Fed! As I awaited the FOMC announcement, I thought that the markets were expecting a highly dovish message that any hint of a balanced statement would cause the markets to sell off. Indeed, stock prices duly tanked as the FOMC statement appeared to have "disappointed" the market with a statement that was not even more dovish.
Even the bond market was not immune from the selloff, as a lot of dovish expectations were already built into bond prices. Across the Curve wrote on October 28 that there was a crowded long in the belly of the curve:
In the Treasury market the risk is in the belly of the curve as traders and investors have plowed back into that sector and have reloaded the carry trade which fears of taper had led them to regurgitate in the May/July period. So if there is even a hint that that Fed might taper in 2013 that sector and associated spread product is at great risk.As an example of the extent of the recovery in the belly you can observe that the 2 year/5 year spread traded as wide as 134 basis points in early September when the market was at its worst levels (10s traded 3 percent then). That spread is now bank to 97 basis points as fear of tapering has receded rapidly.
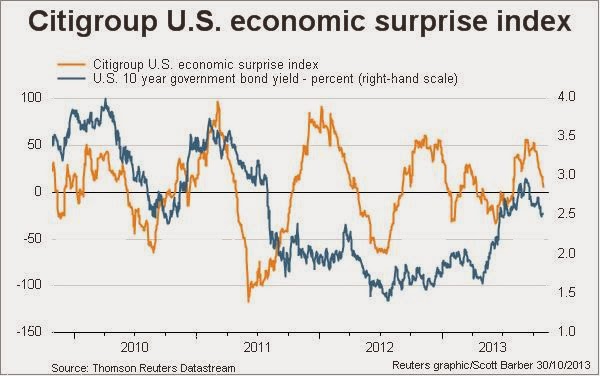
Nevertheless, I believe that there may be a near-term trading opportunity to go long the bond market here. The momentum in high frequency economic releases have been tanking, as shown by this chart of the Citigroup US Economic Surprise Index - and that should be conducive to lower bond yields (and therefore higher bond prices):
What's more, Jon ("Fedwire") Hilsenrath wrote yesterday that Fed researchers believed that the Fed balance sheet would not return to normal until 2019 at the earliest. How much more or a bond bullish environment do you want?
The technical picture for bonds
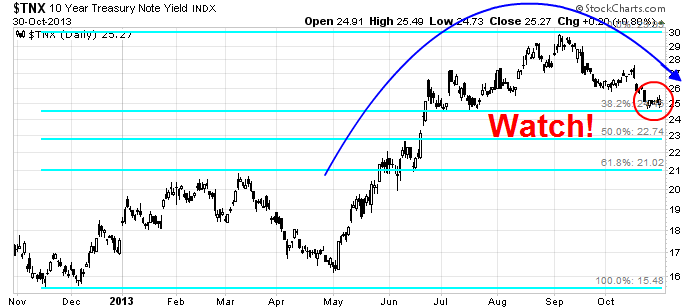
From a technical viewpoint, the 10-year yield has been rolling over, but it is nearing a key level of technical support from both a chart support viewpoint but also a 38% Fibonacci retracement level. Should yields breach the key 2.43-2.50 level, there could be further downside to yields.
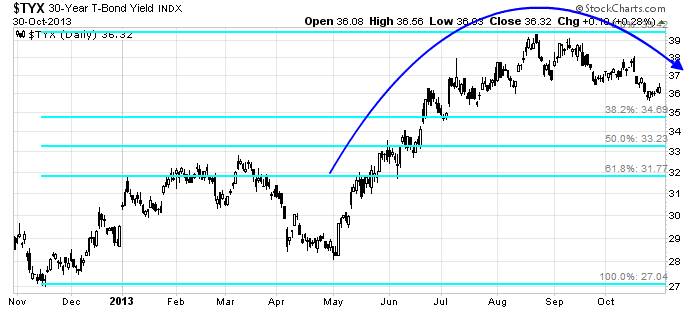
The area of greater opportunity could come from the long bond. This chart of the 30-year yield shows that a similar topping pattern, but it has not reached the 38% Fibonacci support level yet, indicating further near-term downside.
In conclusion, recent economic releases are weak and supportive of lower bond yields and higher bond prices. From a technical perspective, there is a better upside opportunity in the long Treasury in this trade.
Disclosure: Cam Hui is a portfolio manager at Qwest Investment Fund Management Ltd. (“Qwest”). The opinions and any recommendations expressed in the blog are those of the author and do not reflect the opinions and recommendations of Qwest. Qwest reviews Mr. Hui’s blog to ensure it is connected with Mr. Hui’s obligation to deal fairly, honestly and in good faith with the blog’s readers.”
None of the information or opinions expressed in this blog constitutes a solicitation for the purchase or sale of any security or other instrument. Nothing in this blog constitutes investment advice and any recommendations that may be contained herein have not been based upon a consideration of the investment objectives, financial situation or particular needs of any specific recipient. Any purchase or sale activity in any securities or other instrument should be based upon your own analysis and conclusions. Past performance is not indicative of future results. Either Qwest or I may hold or control long or short positions in the securities or instruments mentioned.
