Being a contrarian at heart, it's not easy playing the options game. With that in mind, I really have a tough time playing for reversals, as gaming tops/bottoms is a loser's game. I prefer to see a reversal and then confirmation, get in for the 'meat' of the move and escape when I'm satisfied with a gain and/or the chart is giving me a signal - before anyone sees me.
But, how do we play an oversold market within a longer term up trend? I won't call the turn, and I'll probably be late to get on board that trend but that's fine by me. However, the operative action for better than a year has been to buy the dip, and those dip chances do not last long. Until that pattern changes then I will continue to play it that way.
There are several different sentiment indicators that work well as predictors of short term trend changes. These include VIX, put/call ratio, Rydex ratio, sentiment polls, support/resistance levels (magnets), bullish/bearish percent and the McClellan Oscillator. They are all pretty reliable, but for the speed for which this market turns the two best indicators for me are the VIX and the McClellan Oscillator. Today, we'll focus on the McClellan, which has accurately called very extreme market conditions and the eventual quick turns. As an options trader, following these signals are crucial to finding entry levels for bullish/bearish plays. The McClellan not only tells us the condition of the market but has been used as a great predictor of short term changes in trend.
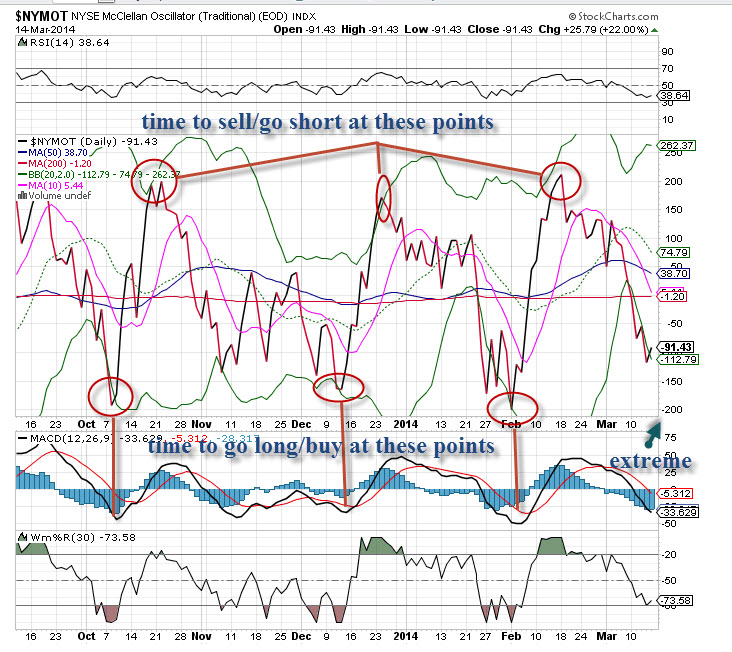
The Oscillator is a smoothed moving average of the advance/decline line. Simply put, a negative reading shows money flowing out while a positive reading shows the opposite. Extreme readings are points of exhaustion where we can expect some pretty severe moves in the opposite direction to occur - imminently. I score these as overbought with a reading of +100 to -100, with higher or lower numbers 'too extreme' and due to reverse the trend (overshooting the move). While this is a raw and crude way to interpret the condition, adding up the values for a time period may be more useful, called the Summation Index.
Take a look at the charts below for the NYSE McClellan Oscillator, which I use regularly to see where we are at and where we might be going. You can see from the circled areas on the chart there were ideal points to get bullish/bearish. The deep oversold readings (big minus numbers) were areas to go long, while big positive numbers were areas to sell or short. All were ideal places to go 'against the grain'. I will often look for these conditions and place a contrarian bet as the market is due for a change. Currently, we're oversold but not to the extent where a 'slingshot-type' move is imminent. That could be coming soon!