A Powerful Key Turn Date At The End Of March
No market exists in splendid isolation. When any market moves, it impacts other markets—to some degree. When several markets reverse direction simultaneously, I call that a Key Turn Date (KTD) and see that as a powerful market signal. The power of the “signal” increases with the size of the markets that turn and the “drama” of the turn—a “V” shaped turn being more powerful than a “U” shaped turn.
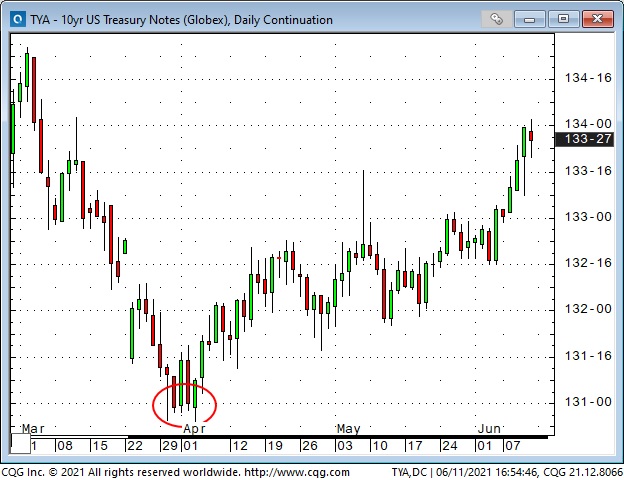
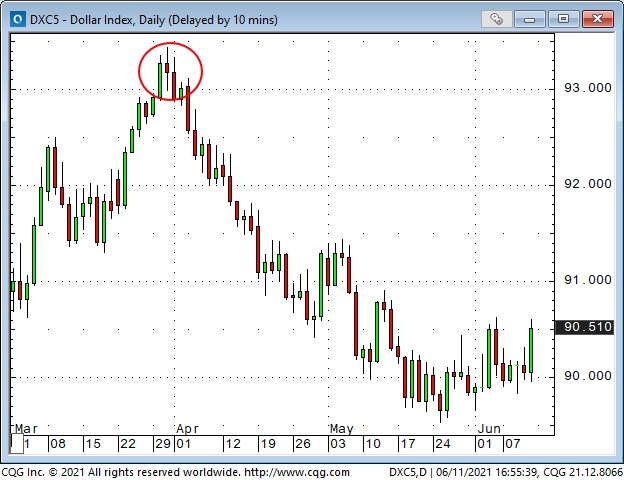
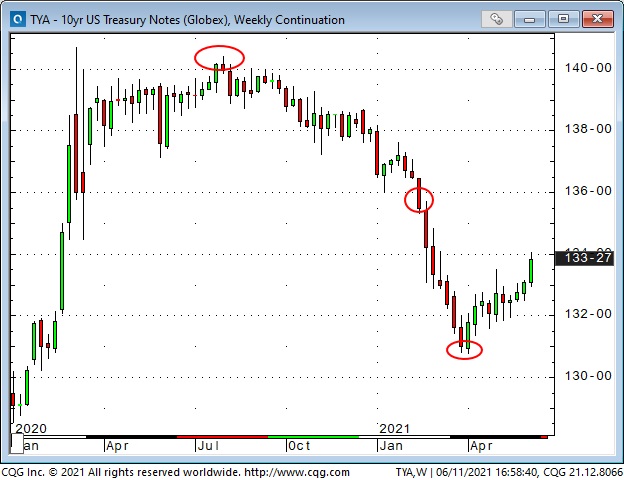
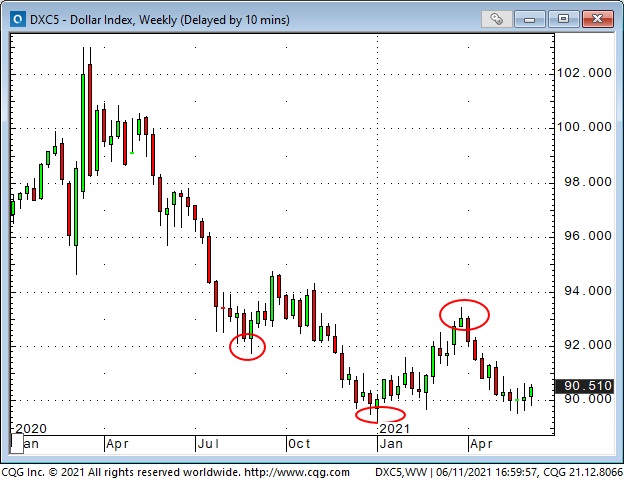
The bond market and the currency market each registered a powerful KTD at the end of March/beginning of April.
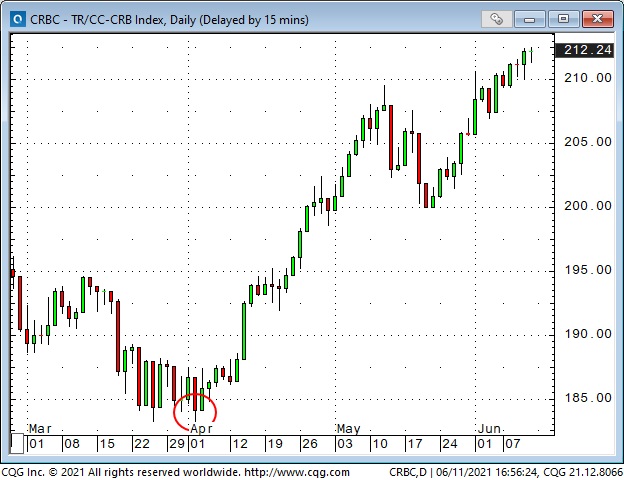
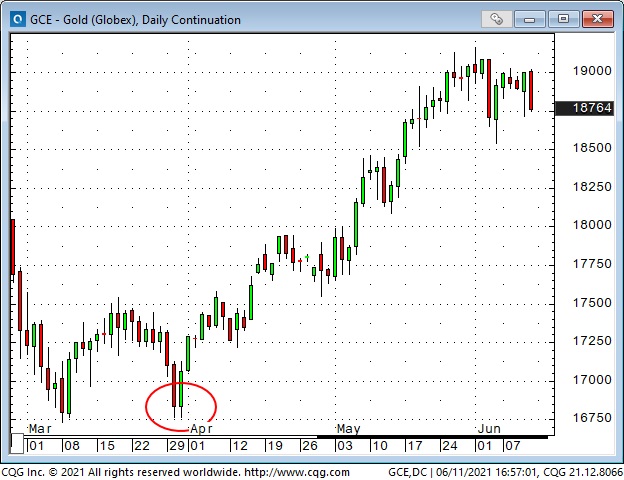
The commodity market and gold also turned higher on the KTD, and have continued higher.
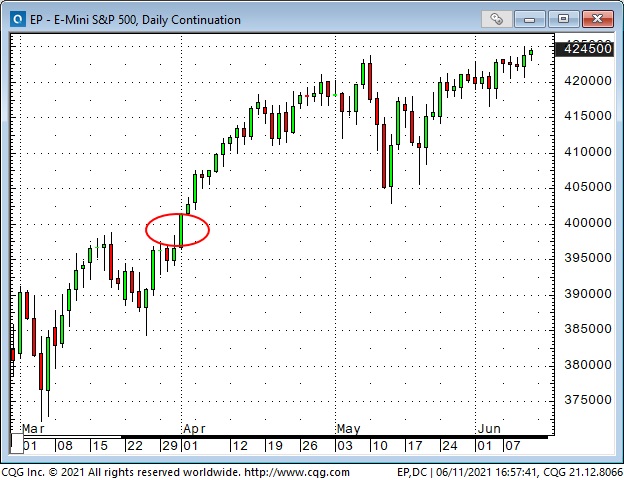
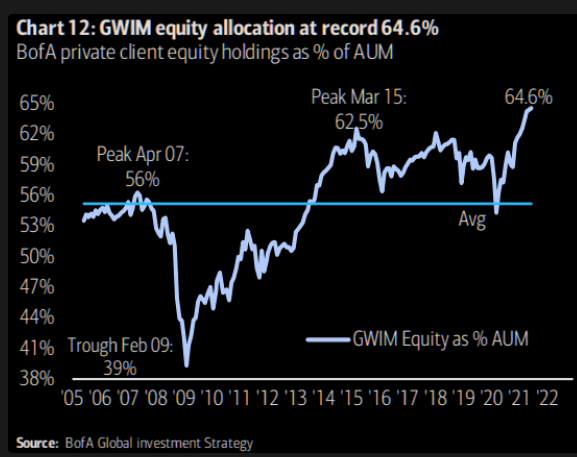
The stock market broke out to new All-Time Highs on the KTD, and continued higher.
Bond prices had a strong negative correlation with the US dollar YTD—is that ending?
Bonds broke sharply lower the first week of January as the USD bounced from 30-month lows. For the next three months, until the KTD at the end of March, bonds trended lower, while the USD trended higher. Following the KTD, bonds have trended higher, and the dollar has trended lower—until three weeks ago—since then, bonds have accelerated their rally, but the USD has turned higher. Is the tight Dollar/Bond correlation breaking down? What’s the trade?
What’s Driving The Bond Rally From The March Lows?
Bond prices fell like a stone from January through March. Money manager surveys during that period showed high expectations of 10-year yields above 2% by Q4 2021. Expectations were for massive fiscal stimulus from the Biden administration.
Inflation expectations were high—so high that Old School thinking (hopes) was that the Fed would cave on their promise to maintain an ultra-easy monetary policy. The stock market was surging with huge capital inflows.
The consensus thinking was that the economy wasn’t just recovering from a recession; it was beginning a whole new expansion. As a result, the Bond Vigilantes were short Treasuries in size.
But then the Biden honeymoon started to fade. His chances of getting massive spending programs through Congress looked slim. The inflation narrative started to shift towards “transitory,” and maybe the Fed was right, after all. Bond auctions were well bid. US yields looked pretty good relative to the rest of the world. The market shook off the highest CPI number in years on Thursday and had its best weekly gain in a year. Shorts were throwing in the towel.
The bond bears might argue that the market has only bounced back about 30% of the decline from last summer’s high—just a little dead cat bounce.
Transitory—Or Not?
Many very bright, veteran market observers have absolutely opposite views on whether or not inflation will be transitory—or will become a serious problem. Mervyn King, Governor of the BOE from 2003 to 2013, has written a brief letter telling us that massive monetary and fiscal stimulus will be an inflationary problem and that political pressures (and other issues) have weakened Central Bank independence and, as a result, they will be slow to respond to signs of higher inflation. I’m sympathetic to his Old School views, but he might be wrong.
I remember writing in late 2018 that we had a “New Fed” under Chairman Jerome Powell. I expected that he wasn’t going to be an “easy money” guy like Bernanke and Yellen (remember his ” long way from neutral” remark.) But I was proved wrong. He changed his tune when the stock market sold off hard in the fall of 2018.
It looks like we now have a “New New Fed,” which won’t be hiking in response to developments that would have had the “Old Fed” (of Mervyn King’s era) slamming on the brakes.
I expect that the New New Fed will choose to be behind the curve if/when/as inflation heats up—unless the inflation shows up as sharply rising wages. If the Fed is late to act, they may have to take strong action quickly, which could shock markets.
The Canadian Dollar
The CAD rallied from 68 cents in March 2020 to a 6-year high at 83 cents—its strongest 15-month rally since early 2009. The CAD rally has been highly correlated with the strength of commodities and stocks and the USD’s weakness. As a result, net speculative positioning in the futures market has become very bullish on the CAD. I believe speculators are long the CAD as a play on the commodities market. (Multi-year correlations between the CAD and the CRB are very tight.)
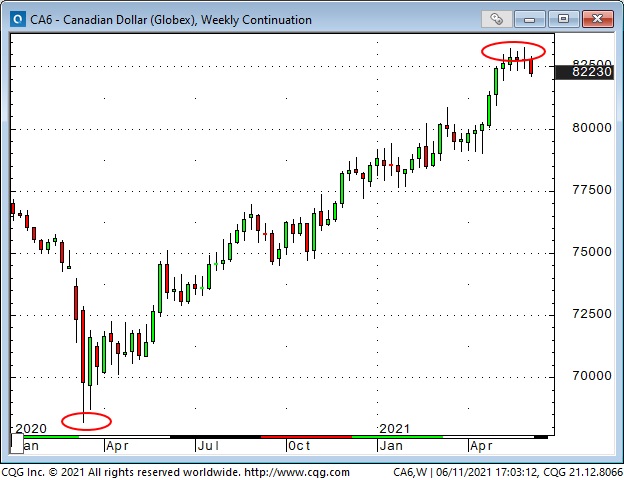
I’ve been skeptical of the CAD above 82 cents, as I’ve been skeptical of the massive speculative buying of all things “commodity,” and I’ve been shorting or buying puts on the CAD.
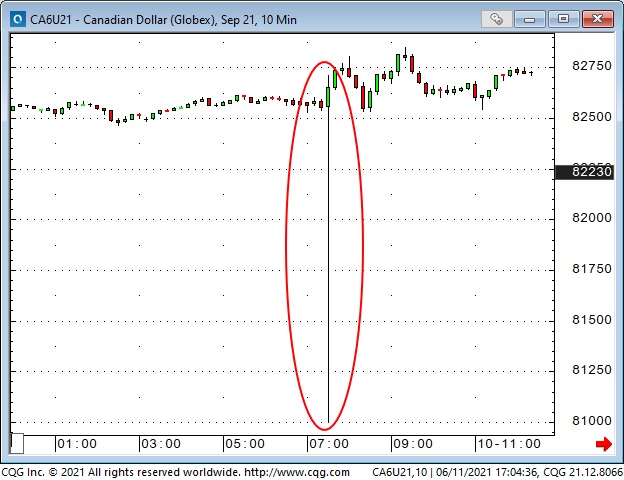
Flash crash in the Canadian Dollar Thursday on the CPI report
The liquidity in the CAD futures market is usually excellent, with more than $50 million on either side of a very tight bid/offer spread. But, as often happens across markets moments ahead of an important scheduled release, dealers pulled their bids and offers Thursday morning just ahead of the CPI report.
The September contract of the CAD dropped and rebounded ~2 cents in less than one minute. Somebody got stopped out of a long position down near 81 cents!
Lumber
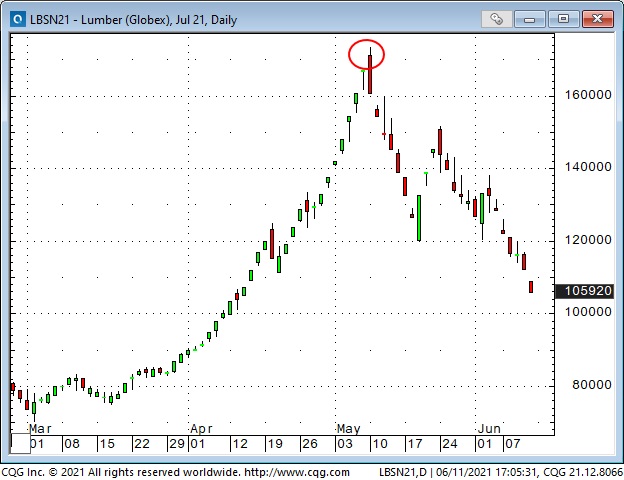
There is an old saying to the effect that when something is making front-page news, it’s over. Lumber had a spectacular run, and it’s over. This might be the poster child for “transitory” supply shocks. Will there be more to come?
Copper
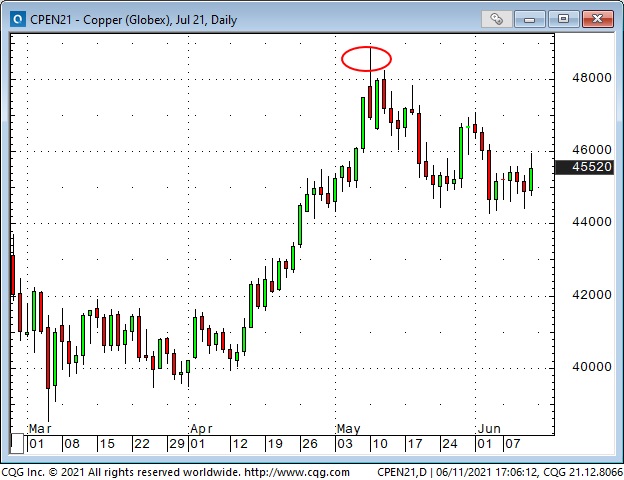
Another commodity that was making front-page news was copper. It was such an incredibly bullish story that copper made new All-Time Highs, like lumber. It’s interesting that copper and lumber both peaked on the same day—May 10.
Soybeans
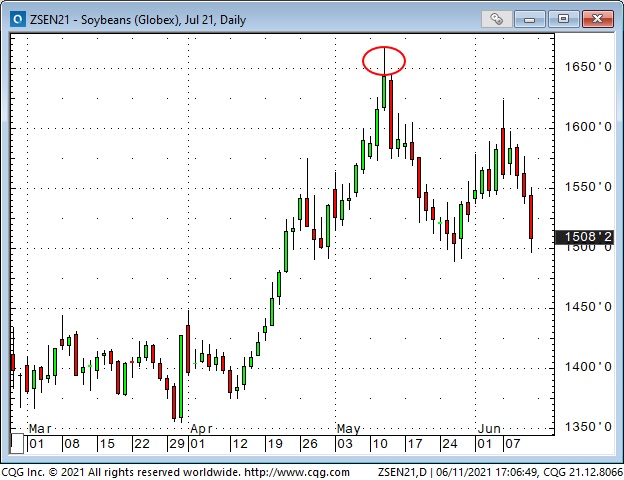
Soybeans didn’t make new All-Time Highs, but they did more than double in price from last year’s lows to print 9-year highs—two days after lumber and copper peaked.
WTI Crude Oil
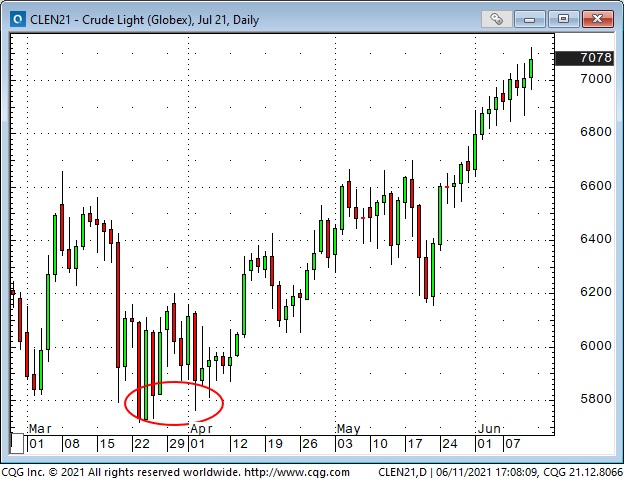
WTI closed last week at 34-month highs—up $10 in the last 15 trading days. The IEA sees global demand rising above pre-pandemic levels by Q4 2022 (as if that matters to today’s speculators!)
My Short Term Trading
I started last week owning puts on both the AUD and the CAD. I was bearish both markets thinking that the commodity rally was overdone—but also the charts on both markets looked like they could break lower. While I held my puts, the sideways drift in both markets meant that the clock was working against me (theta bleed.) The previous week I wrote that I would throw in the towel if the AUD and CAD didn’t break down; nothing wrong with being wrong except staying wrong.
To reduce risk, I covered my AUD position Thursday for about 50% of what I paid for it, resulting in a loss of ~1/3rd of 1% of trading capital. I still own the CAD puts. I chose to keep the CAD and close the AUD because the CAD has a relatively huge net spec long position (which makes it vulnerable if the market breaks) while specs are virtually flat the AUD.
With Friday’s breakdown in both currencies, I wish I had stayed with my AUD puts, but I made the right move Thursday to de-risk positions that were not working.
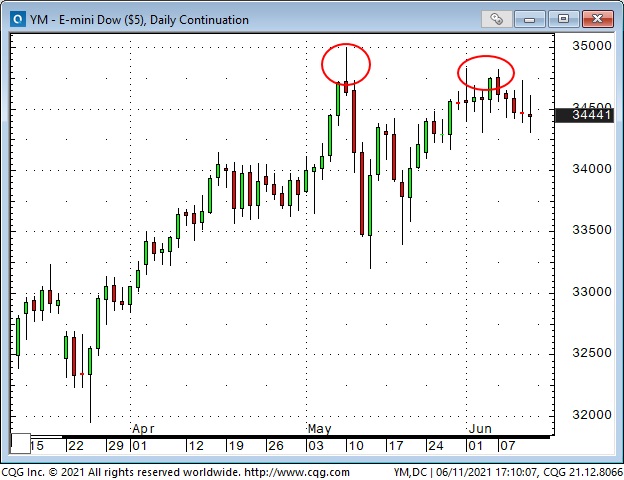
I shorted an initial position of Dow Jones futures Friday as the market looked like it was rolling over from a double-top. My stops are below last week’s highs.
On My Radar
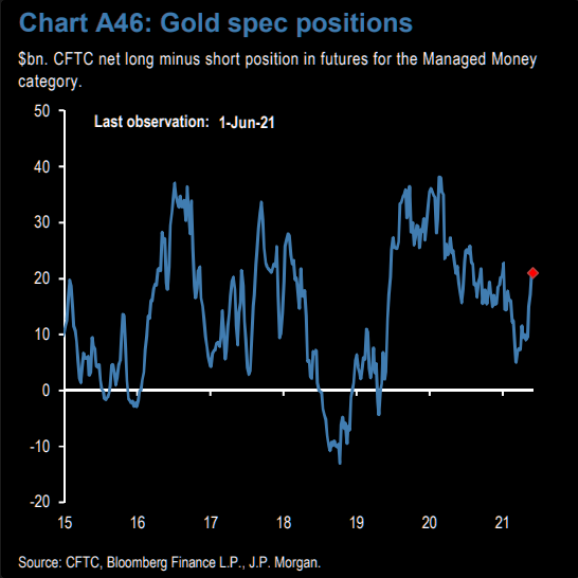
I shorted gold two weeks ago and was stopped for a small loss. A few days later, gold tumbled > $50 but bounced back to the $1900 level. I think gold ran up over $200 since late March as the USD weakened and on the “inflation” narrative.
I think it could be rolling over here, and I might get short again if I can find a spot with limited risk. (Note: this is a short-term trading idea—I’m looking at trading a chart setup—not expressing a long-term view on gold.)
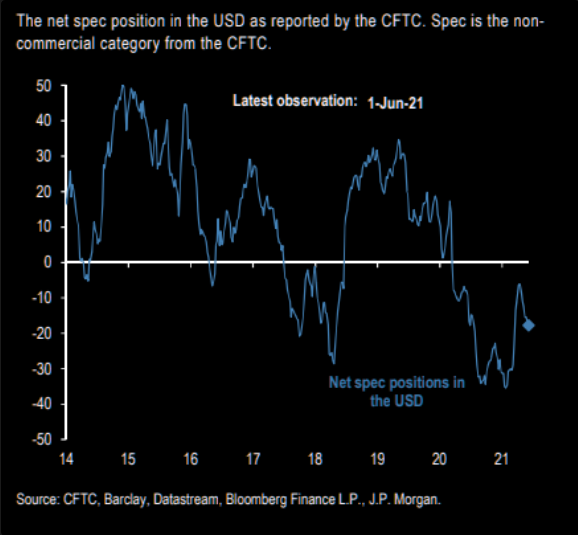
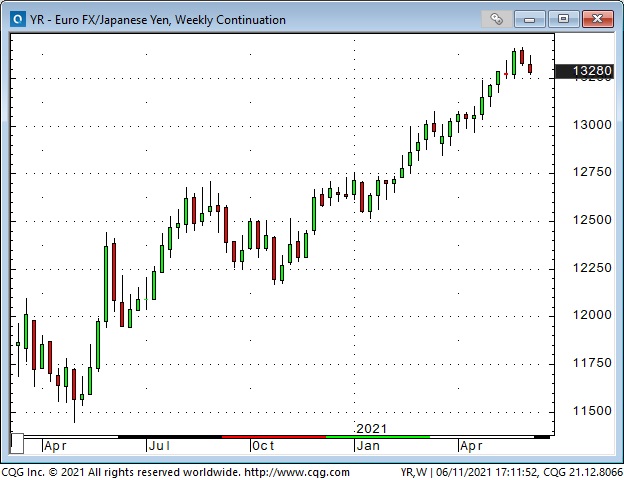
I think the USD might be turning up—speculators are very short again. The anti-dollar has been the euro, and speculators are very net long the Euro. I might try to short EUR/USD, but I’m also interested in the euro/yen chart.
It was interesting to see WTI run to new highs last week while heating oil and gasoline didn’t. I think WTI has probably run too far too fast, but I won’t short a market that is making new highs— but show me some weakness, and I’ll get very interested!
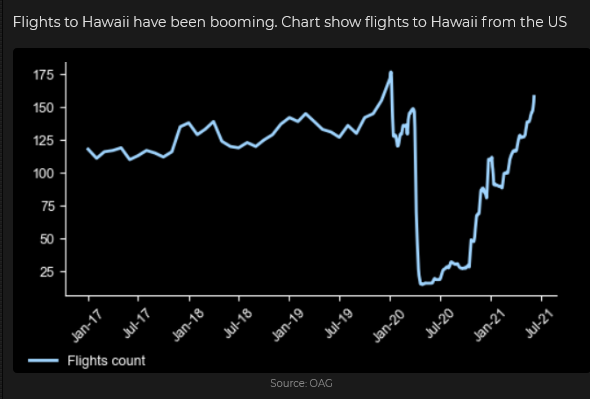
Aloha!!
