There have been ongoing worries that the Chinese economy is contracting based on recent economic data indicating a manufacturing slowdown. Further reports of the governments desire and attempts to cool property speculation have been ubiquitous. With regards to the latter, the government has been steadily raising bank reserve requirements in an attempt to moderate speculation.
On May 2nd, 2012 the government announced an improvement in a manufacturing report for PMI (Purchasing Managers Index). It rose modestly from 49.1 to 49.3 reversing an ongoing slide if only slightly. The meager rise didn’t stop bulls from rallying stocks including Hong Kong (1%) and the Shanghai CSI 300 Index (2.18%) in an obvious short squeeze.
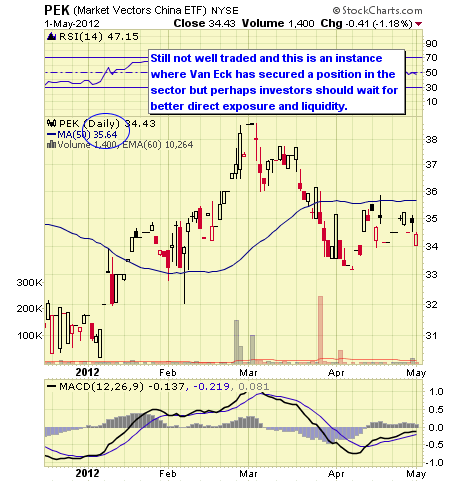
In the U.S., you may trade both the iShares Hong Kong ETF (EWH) and the more recently issued Van Eck China ETF (PEK), which is linked to the CSI 300 Index. However, with the latter, it has been trading at a premium to the index owing to limitations the Chinese government has over foreign investors.
To work around this until restraints are removed (and this has been happening lately) Van Eck has an arrangement with Credit Suisse to use a note issued by the bank (a derivative) as exposure to the CSI 300 Index. This has created a premium for PEK, which is beginning to dwindle (now at just over 2%). Nevertheless this has led investors to stand aside from PEK given recent troubles Credit Suisse had with TVIX which were unique from its relationship with PEK.
The bottom line is we’ve been following the Shanghai CSI 300 Index for several years and are patiently waiting to trade it once liquidity improves (currently trading less than 2K shares per day).
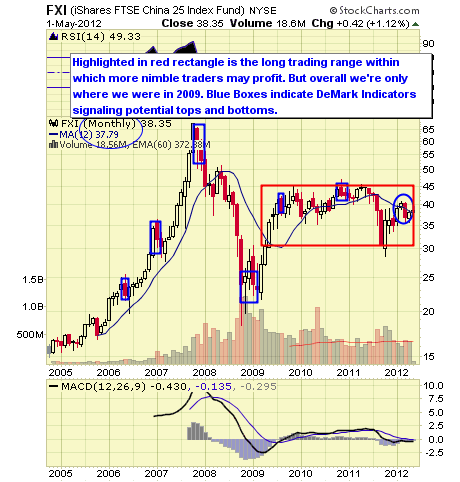
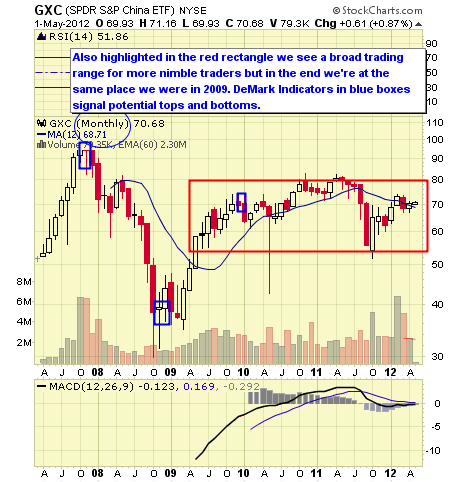
More conventional approaches beyond EWH and PEK have been SPDR China ETF (GXC) and the most popular FTSE Xinhua 25 ETF (FXI).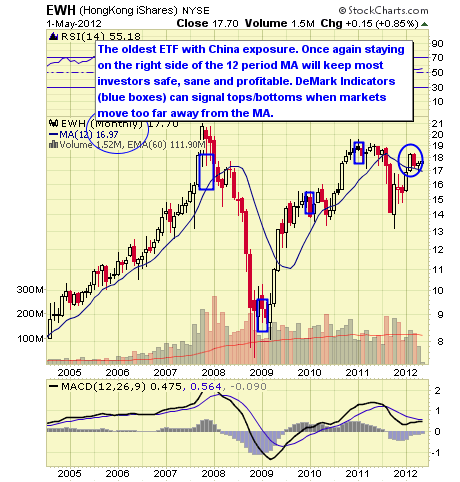
Below is our internal chart of the Shanghai CSI 300 Index from a “monthly” view. Annotations include a variety of moving averages and DeMark sequential counts.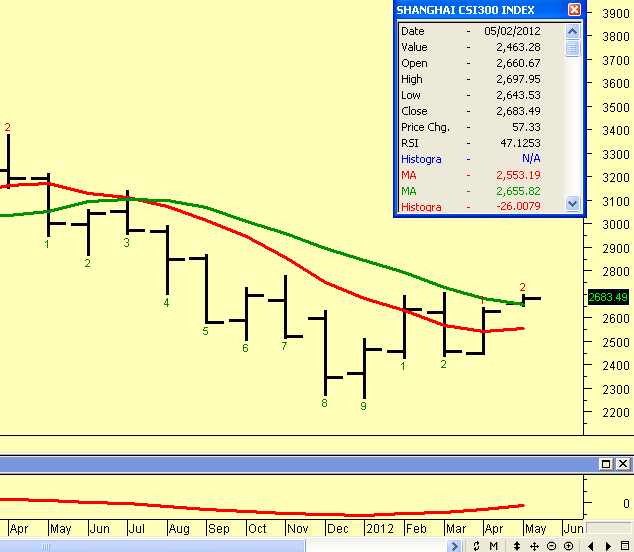
Disclosure: Long EWH.
- English (UK)
- English (India)
- English (Canada)
- English (Australia)
- English (South Africa)
- English (Philippines)
- English (Nigeria)
- Deutsch
- Español (España)
- Español (México)
- Français
- Italiano
- Nederlands
- Português (Portugal)
- Polski
- Português (Brasil)
- Русский
- Türkçe
- العربية
- Ελληνικά
- Svenska
- Suomi
- עברית
- 日本語
- 한국어
- 简体中文
- 繁體中文
- Bahasa Indonesia
- Bahasa Melayu
- ไทย
- Tiếng Việt
- हिंदी
Trading China's Economy: China ETFs In Focus
Published 05/03/2012, 12:42 AM
Updated 05/14/2017, 06:45 AM
Trading China's Economy: China ETFs In Focus
Latest comments
Loading next article…
Install Our App
Risk Disclosure: Trading in financial instruments and/or cryptocurrencies involves high risks including the risk of losing some, or all, of your investment amount, and may not be suitable for all investors. Prices of cryptocurrencies are extremely volatile and may be affected by external factors such as financial, regulatory or political events. Trading on margin increases the financial risks.
Before deciding to trade in financial instrument or cryptocurrencies you should be fully informed of the risks and costs associated with trading the financial markets, carefully consider your investment objectives, level of experience, and risk appetite, and seek professional advice where needed.
Fusion Media would like to remind you that the data contained in this website is not necessarily real-time nor accurate. The data and prices on the website are not necessarily provided by any market or exchange, but may be provided by market makers, and so prices may not be accurate and may differ from the actual price at any given market, meaning prices are indicative and not appropriate for trading purposes. Fusion Media and any provider of the data contained in this website will not accept liability for any loss or damage as a result of your trading, or your reliance on the information contained within this website.
It is prohibited to use, store, reproduce, display, modify, transmit or distribute the data contained in this website without the explicit prior written permission of Fusion Media and/or the data provider. All intellectual property rights are reserved by the providers and/or the exchange providing the data contained in this website.
Fusion Media may be compensated by the advertisers that appear on the website, based on your interaction with the advertisements or advertisers.
© 2007-2025 - Fusion Media Limited. All Rights Reserved.
