U.S. fixed income was already on a roll this year, but this week’s renewed concerns about the U.S.-China trade battle have strengthened the bull market in bonds as a fresh run of risk-off sentiment weighs on equities around the world.
While U.S. and foreign stocks have tumbled, U.S. investment-grade bonds have rallied, based on a set of exchange-traded funds. Junk bonds have ticked lower this week, albeit slightly. Otherwise, all the major U.S. bond categories have gained ground this week amid new worries that the U.S. and China are on a collision course over trade.
“A trade deal had been priced into markets, and now we are living through the fallout of altered expectations, so it wouldn’t be surprising to see continued volatility,” advises Kristina Hooper, chief global market strategist for Invesco. “We’re going to see both sides playing a game of chicken.”
The pivot to trade has been an earthquake for sentiment, another analyst observes. “This pretty much throws out most of the fundamental thought as we began this week, and trade has now become the most talked about and influential market-moving event on the board,” writes Kevin Giddis, head of fixed income at Raymond James. “Forget last week’s economic data. Forget this week’s Treasury financings. Forget where the Fed stands.”
What’s bad for stocks has been good for bonds. Although both asset classes have enjoyed solid gains for 2019 overall, this week’s trade news has sent the two markets on divergent paths. It’s anyone’s guess what happens next, courtesy of President Donald Trump’s mercurial policy decisions. But for the moment, the greater appetite for U.S. fixed income stands in contrast with the crowd’s decision to flee stocks.
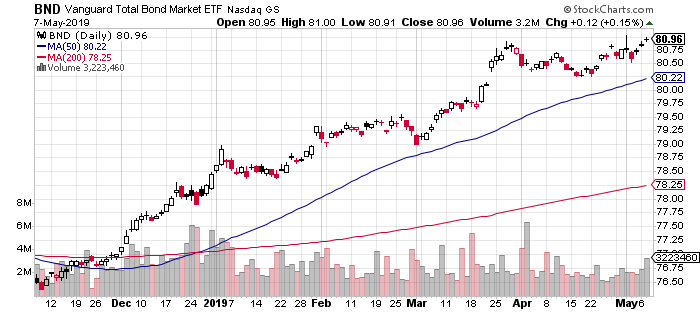
The rejuvenated search for safe havens lifted Vanguard Total Bond (NYSE:BND) to a new record close yesterday (May 7), based on prices that reflect total-return data.
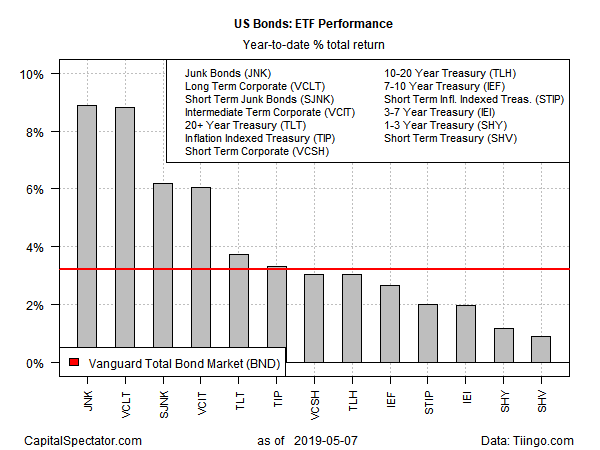
Ranking the major categories of U.S. bonds on year-to-date results still puts US junk bonds at the top of the list. SPDR Barclays High Yield Bond (NYSE:JNK) is up 8.9% in 2019 on a total-return basis – well ahead of the broad investment-grade fixed-income market’s 3.2% year-to-date gain via BND.
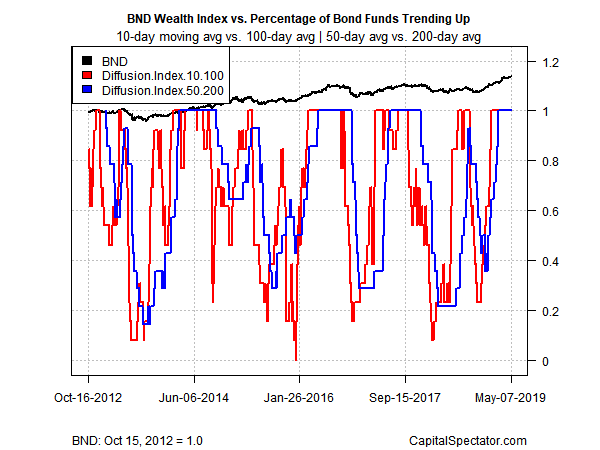
Profiling the bond market subsets based on momentum for the ETFs listed above shows that a clean sweep of upside bias prevails via two sets of moving averages. The first definition compares the 10-day moving with the 100-day average, a measure of short-term trending behavior (red line in chart below). A second set of moving averages (50 and 200 days) offers an intermediate measure of the trend (blue line). The indexes range from 0 (all funds trending down) to 1.0 (all funds trending up). Based on this data through yesterday’s close, bullish momentum dominates in all the major corners of U.S. fixed income.


