The Dow Jones Transportation Index took a shot to the face when FedEx (NYSE:FDX) announced a slow down in December. But this was a secondary punch. It had already started to move lower off of a September high. Like the rest of the market, it was already following an easier path lower. Now that it is moving higher is the drop over?
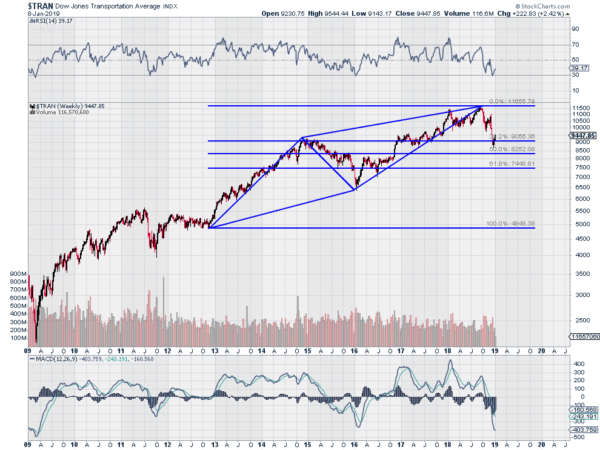
Looking at the technicals a case can be made for either direction. The chart below shows the Index completing an extended AB=CD pattern in September that started off of the 2012 low. Extended because the CD leg is longer than the AB leg. This usually leads to a retracement and it has retraced over 38.2% of the pattern.

This would be a good place for a reversal to happen. It also has seen the RSI momentum indicator hit the oversold level and reverse. This is the same spot the RSI bottomed and then price reversed in 2016 and 2011. At the bottom of the chart the MACD is also at an extreme low level that was followed by a reversal in 2009, 2011 and 2016.
On the other side of the story is the intermediate trend. For the short term this is just a counter trend bounce. Yes all reversals start this way but they do not all have to continue. The 2 legs lower off of the September high, with the bounces, can be seen as the first 4 waves of an impulse wave to the downside with the 5th wave still to come. A similar 3rd leg would reach the 61.8% retracement of the pattern. This is a common reversal area.
So which is it, a reversal or a pause before another leg lower?
The information in this blog post represents my own opinions and does not contain a recommendation for any particular security or investment. I or my affiliates may hold positions or other interests in securities mentioned in the Blog, please see my Disclaimer page for my full disclaimer.
