When it comes to tracking ETF’s the there are winners and losers. The Equity Indexes S&P 500, Russell 2000 and NASDAQ are tracked very well by the (SPY), (IWM) and (QQQ). Maybe because there is a lot of liquidity in these ETF’s, and the Indexes are not easily traded outside of the Futures. Maybe they have been around long enough for the fees to be reigned in. Whatever the case they are a good fit. 
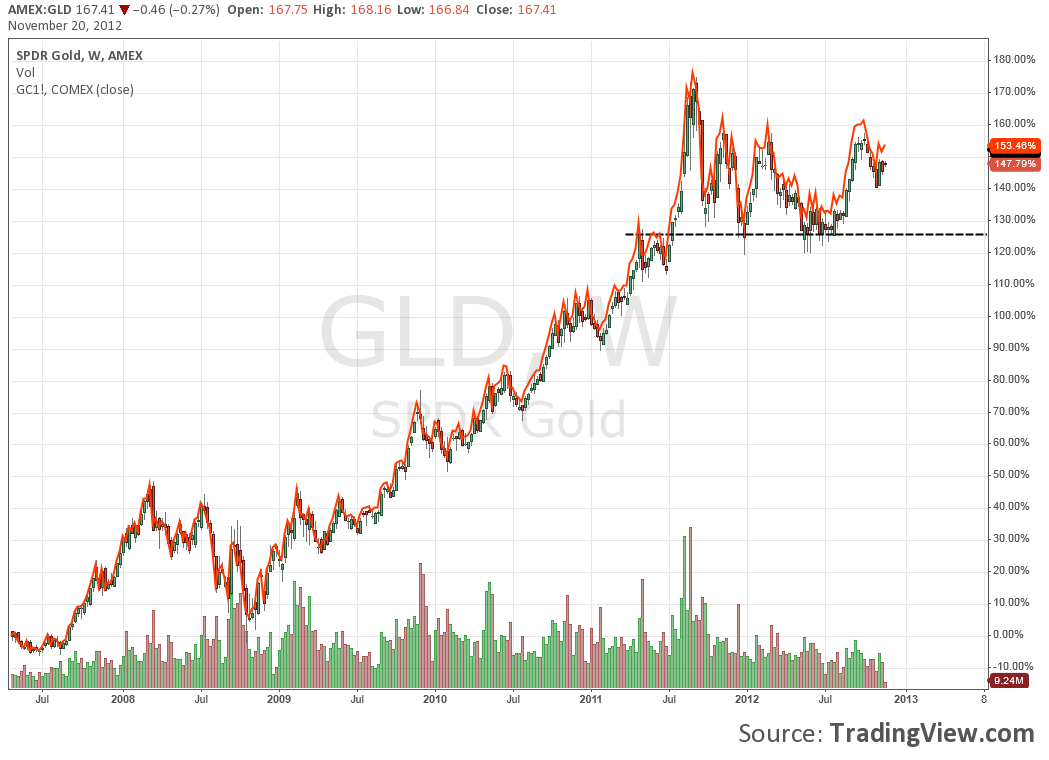
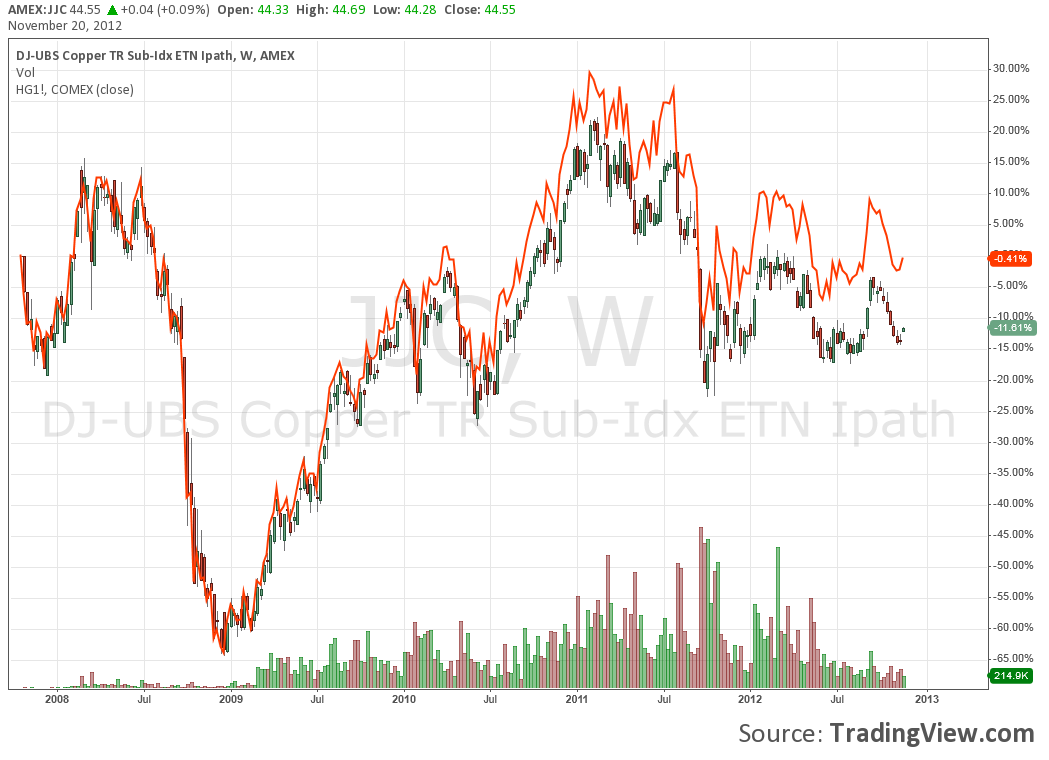
But when you get out side of these the tracking ETF’s are not all created equal. Take a look at the metals. The chart for Gold above shows the Futures and the ETF (GLD). On a first glance you cannot tell the difference between the two with the Futures looking more like a 2-day Simple Moving Average. The chart below for Copper Futures against the ETF (JJC) is similar but with a little more dispersion. 
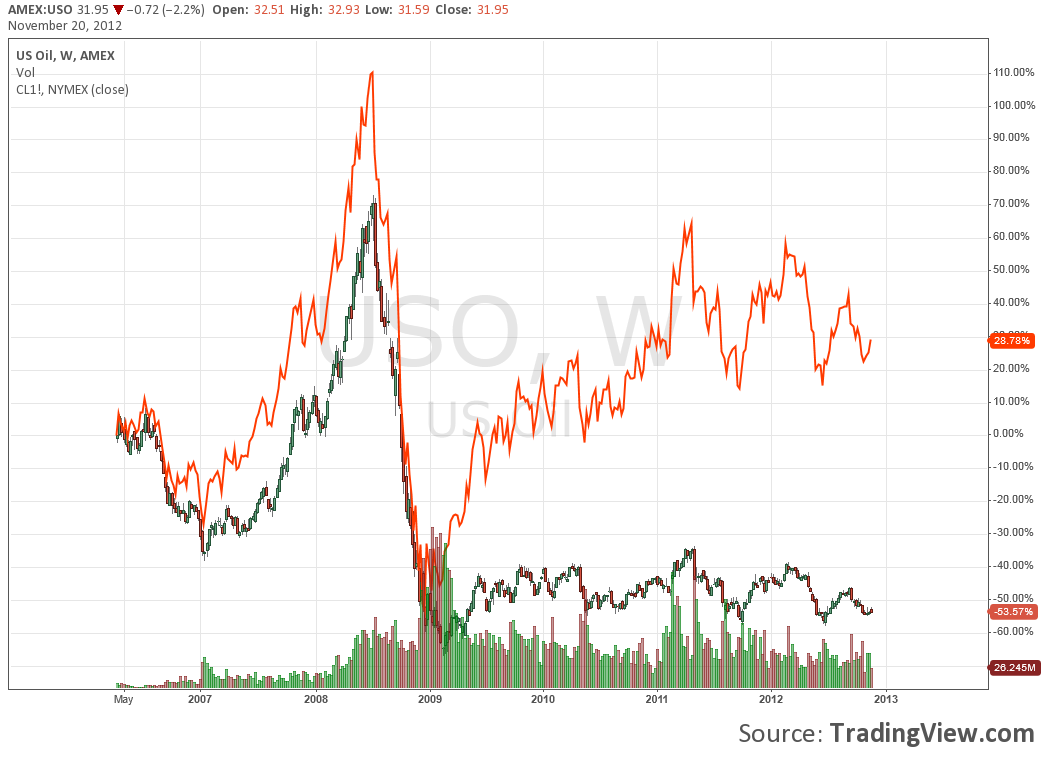
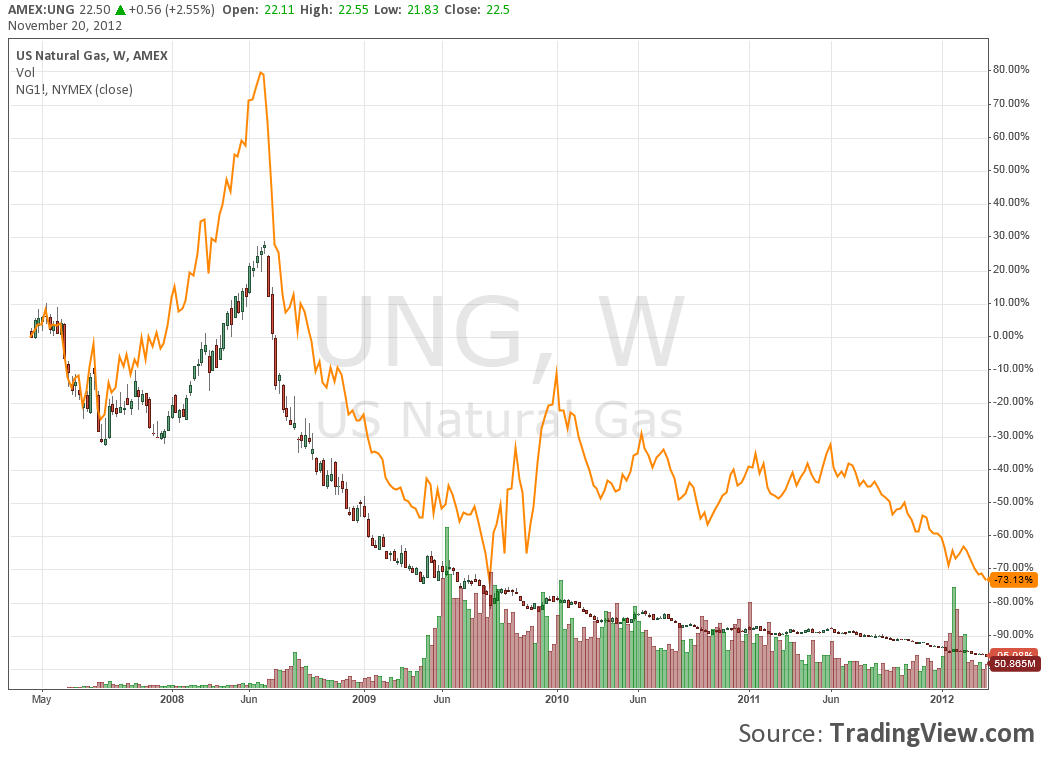
But when you compare these to the energy charts it gets crazy. Look at the comparison for Crude Oil Futures and the ETF (USO) in the chart below. After tracking well up through the fall into 2009 the Futures have been up big over the last 3 years with the ETF running sideways. Hmmm. But this is not an isolated case. The last chart, Natural Gas Futures and the ETF (UNG) is just as bad. The general downtrend is the same but look at the bump in Futures with a steady decay in the ETF. You could run a lot of quantitative analysis on fees on each fund and determine the liquidity of the underlying and perhaps come up with a solid explanation for this. For me it is enough to know that they do not track well and only use them for very short-term purposes if at all.
Disclaimer: The information in this blog post represents my own opinions and does not contain a recommendation for any particular security or investment. I or my affiliates may hold positions or other interests in securities mentioned in the Blog, please see my Disclaimer page for my full disclaimer.
Original post
- English (UK)
- English (India)
- English (Canada)
- English (Australia)
- English (South Africa)
- English (Philippines)
- English (Nigeria)
- Deutsch
- Español (España)
- Español (México)
- Français
- Italiano
- Nederlands
- Português (Portugal)
- Polski
- Português (Brasil)
- Русский
- Türkçe
- العربية
- Ελληνικά
- Svenska
- Suomi
- עברית
- 日本語
- 한국어
- 简体中文
- 繁體中文
- Bahasa Indonesia
- Bahasa Melayu
- ไทย
- Tiếng Việt
- हिंदी
Track Metals Not Energy
Published 11/22/2012, 01:57 AM
Updated 05/14/2017, 06:45 AM
Track Metals Not Energy
Latest comments
Loading next article…
Install Our App
Risk Disclosure: Trading in financial instruments and/or cryptocurrencies involves high risks including the risk of losing some, or all, of your investment amount, and may not be suitable for all investors. Prices of cryptocurrencies are extremely volatile and may be affected by external factors such as financial, regulatory or political events. Trading on margin increases the financial risks.
Before deciding to trade in financial instrument or cryptocurrencies you should be fully informed of the risks and costs associated with trading the financial markets, carefully consider your investment objectives, level of experience, and risk appetite, and seek professional advice where needed.
Fusion Media would like to remind you that the data contained in this website is not necessarily real-time nor accurate. The data and prices on the website are not necessarily provided by any market or exchange, but may be provided by market makers, and so prices may not be accurate and may differ from the actual price at any given market, meaning prices are indicative and not appropriate for trading purposes. Fusion Media and any provider of the data contained in this website will not accept liability for any loss or damage as a result of your trading, or your reliance on the information contained within this website.
It is prohibited to use, store, reproduce, display, modify, transmit or distribute the data contained in this website without the explicit prior written permission of Fusion Media and/or the data provider. All intellectual property rights are reserved by the providers and/or the exchange providing the data contained in this website.
Fusion Media may be compensated by the advertisers that appear on the website, based on your interaction with the advertisements or advertisers.
© 2007-2025 - Fusion Media Limited. All Rights Reserved.
