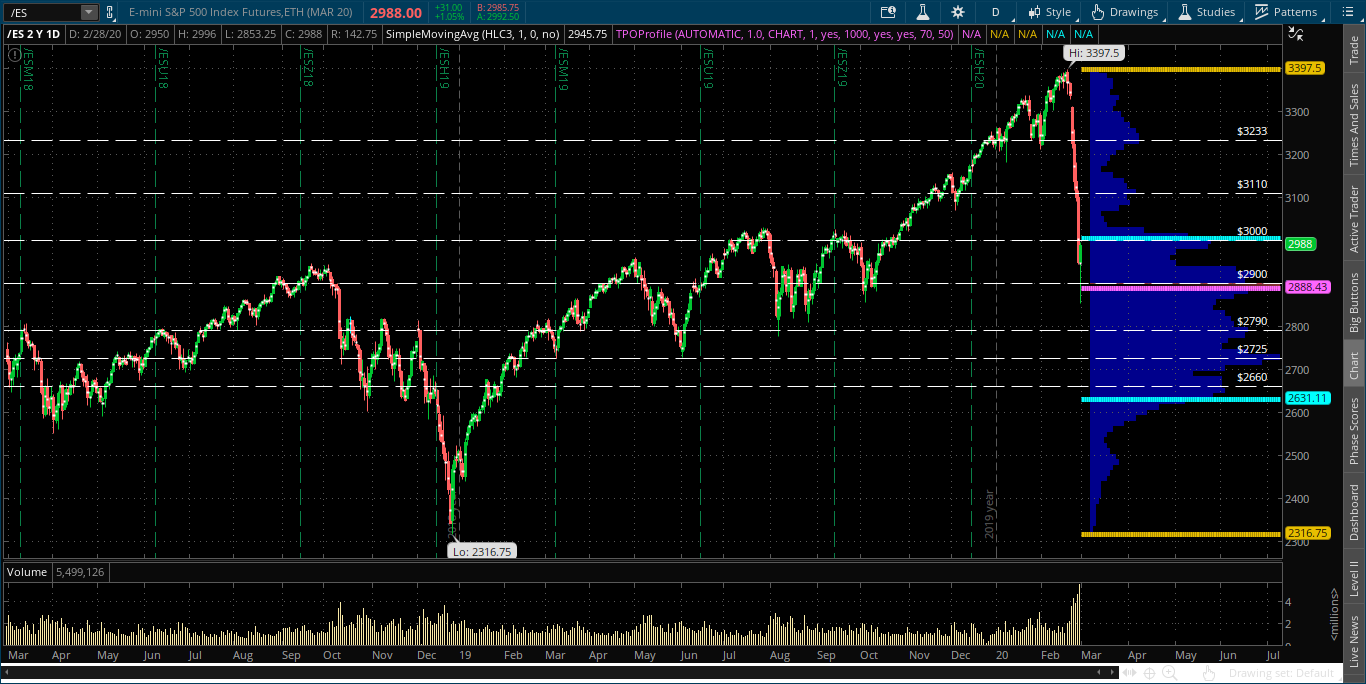
Shown on the right-hand side of the daily chart of the S&P 500 E-mini Futures Index (ES) is a TPO Profile. It represents trading activity over a period of time at specified price levels and is shown in vertical histogram format (dark blue). Its outer edges at the top and bottom are defined by the two yellow lines. The longest row of the TPO defines the price level that was hit the most during the specified time period. This level is called the POC (Point of Control) (pink line). The price range surrounding the POC where 70% of the trading activity occurred is called the Value Area (area in between the two turquoise lines).
The time period I've chosen for this post is two years for the purpose of showing, not only the POC and Value levels, but also the lesser price levels that were hit multiple times that can be used as potential target prices in the event of a further decline, or a reversal to the upside next week (broken white lines).
In Friday's action, the ES plunged down through the POC (2888) and, ultimately, spiked higher to close at 2988, just below the upper edge of the Value Area (3004).
So, those two price levels will be important resistance and support levels in the immediate term. Any sustainable activity in either direction must hold above or below those levels.
The next resistance level is around 3110, while the next support level is around 2790.

Inasmuch as this week's purge brought extremely high volumes, we may be seeing some sort of short-term capitulation, to support a further rally in the ES. However, anything is possible, including a retest of the lows of Friday's hammer before traders come to grips with all accompanying risks, and price direction sorts itself out.
So, trade with caution, as volatility is still alive and kicking!
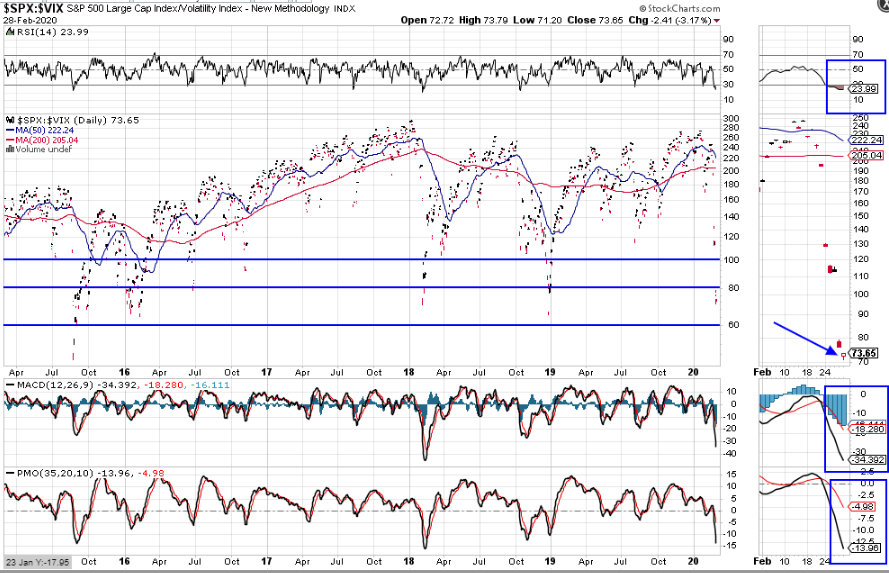
Price has dropped below 80, as shown on the following daily ratio chart of the SPX:VIX ratio.
If we see a rally in the ES next week, this ratio will need to regain and hold above, firstly, 80, then 100, to convince me that any further strength is sustainable.

Otherwise, a further drop towards 60 will also drag the ES down to, potentially, retest the TPO POC (2888) and Friday's low (2853), or lower to, at least, 2790.
Originally published Friday, February 28, 2020
