
Total System Services, Inc’s (NYSE:TSS) third-quarter 2017 earnings per share of 88 cents surpassed the Zacks Consensus Estimate by 14.3% and grew 23.9% year over year.
Revenues of $1.2 million also beat the Zacks Consensus Estimate by 2.5%. Further, revenues grew 8.8% year over year.
Better-than-expected results were driven by growth in consolidated and segment operating income margins. The company’s strong organic revenue growth reflects its exceptional execution of strategic goals.
Total expenses of $1.0 billion increased 5.7% year over year due to higher cost of services.
Total System Services, Inc. Price, Consensus and EPS Surprise
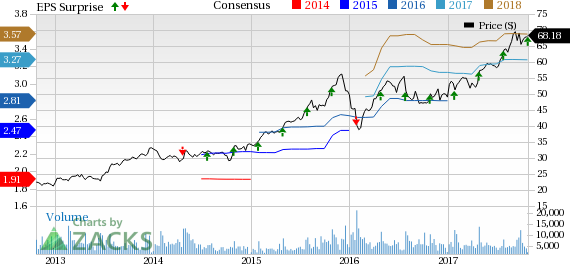
Total System Services, Inc. Price, Consensus and EPS Surprise | Total System Services, Inc. Quote
Segments Results
Issuer Solutions
In the third quarter, net revenues for this segment increased 5.8% year over year to $401.1 million. Total transaction for this segment was $5.5 million, up 8.6% year over year.
Operating income of $147.8 million for the segment was up 14.6% year over year. Operating margin of 36.8% increased from 34% in the year-ago quarter.
Merchant Solutions
Net revenues increased 7.4% to $281.8 million from $262.5 million in the year-ago quarter. Dollar sales volume for this segment grew 9.8% year over year to $31.5 million from $28.7 million.
Operating income advanced 13.8% year over year to $103.3 million. Operating margin rose to 36.6% from 34.4% in the year-ago quarter.
Net Spend
Net revenues increased 15.8% year over year to $179.9 million in the reported quarter. Gross dollar volume for this segment was $7.2 billion, up 13.7% year over year.
Operating income grew 18.9% year over year to $48.6 million. Operating margin increased to 27% from 26.3% in the prior-year quarter.
Financial Update
Total assets decreased 2.3% to $6.2 billion as of Sep 30, 2017 from $6.37 billion at year-end 2016.
Total shareholders’ equity climbed to $2.4 billion on Sep 30, 2017 from $2.1 billion at the end of 2016.
Long-term debt was $2.4 billion at quarter end, down from $3.3 billion at 2016 yearend.
Free cash flow totaled $542.7 million for the nine months ended Sep 30, 2017 compared with $443.7 million for the same period in 2016.
Share Repurchase Update
During the quarter, the company repurchased 0.4 million shares worth $27.6 million.
2017 Guidance Up
The company now expects total revenues on a GAAP basis in the range of $4.83-$4.89 billion (previous expectation $4.80-$4.88 billion) reflecting an increase of 16-17%. On a non-GAAP basis, net revenues are anticipated in the range of $3.34-$3.39 billion (previous expectation $3.31-$3.39 billion) reflecting a rise of 10-12%.
GAAP EPS is projected in the range of $2.37-$2.43 (previous expectation $2.30-$2.38), representing a rise of 37-40%. Adjusted EPS attributable to the company’s common shareholders is estimated in the range of $3.29-$3.35 (previous expectation $3.22-$3.30), reflecting an increase of about 18-20%.
Zacks Rank
Total System Services currently carries a Zacks Rank #2 (Buy). You can see the complete list of today’s Zacks #1 Rank (Strong Buy) stocks here.
Performance of Other Companies in the Finance Sector
Among the other firms in the medical sector that have reported their third-quarter earnings so far, American Express Company (NYSE:AXP) , The Travelers Companies, Inc. (NYSE:TRV) and Discover Financial Services (NYSE:DFS) beat their respective Zacks Consensus Estimate.
Zacks' Hidden Trades
While we share many recommendations and ideas with the public, certain moves are hidden from everyone but selected members of our portfolio services. Would you like to peek behind the curtain today and view them?
Starting now, for the next month, I invite you to follow all Zacks' private buys and sells in real time from value to momentum...from stocks under $10 to ETF to option movers...from insider trades to companies that are about to report positive earnings surprises (we've called them with 80%+ accuracy). You can even look inside portfolios so exclusive that they are normally closed to new investors.
Click here for Zacks' secret trade>>
Discover Financial Services (DFS): Free Stock Analysis Report
American Express Company (AXP): Free Stock Analysis Report
The Travelers Companies, Inc. (TRV): Free Stock Analysis Report
Total System Services, Inc. (TSS): Free Stock Analysis Report
Original post
Zacks Investment Research