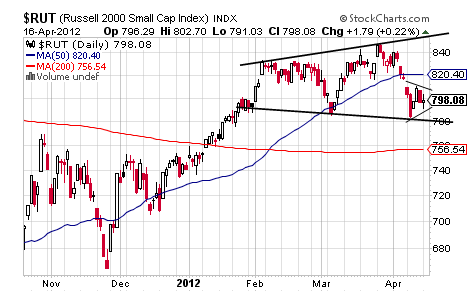
It’s easy to think of a market top or bottom as a single point in time, but it is typically a process that occurs over a period of time as is shown nicely, most likely, by the daily chart of the Russell 2000 below.

This process started back in early March when the Russell 2000 dove for its 50 DMA and something that seemed to signal a 200 DMA dash-to-come and an event that seems increasingly likely as the Russell 2000 hangs below its flattening 50 DMA with a Broadening Top standing by to take this small cap index well below its 200 DMA. However, there is the possibility that the Russell 2000 visits the top trendline of that pattern one more time before potentially making a proper downside break by dropping below 784 for a current target of 720 and well below its 200 DMA and this speaks to the idea that topping is a process and not a point.
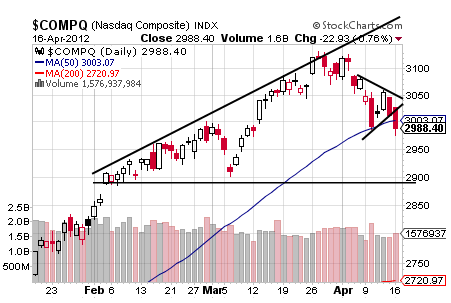
One reason to think that process may accelerate in the days ahead, though, is shown by the Russell 2000’s recent consolidation into what appears to be a Bear Pennant that carries, interestingly, the same 720 target on confirmation of 784 and it remains valid unless the Russell 2000 climbs above $828. One reason to have faith in that Bear Pennant is shown by the Nasdaq Composite’s own Bear Pennant that is working ferociously to confirm.

The Nasdaq Composite’s Bear Pennant confirms on a closing basis at 2987 for a target of 2846 and it remains valid so long as the Nasdaq Composite is below 3086 with its own Broadening Top giving reason to think it will remain valid considering that the pattern confirms at 2885 for a target of 2636.

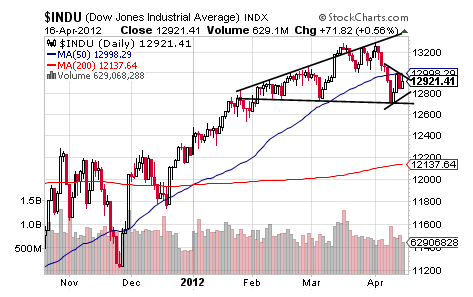
Not surprisingly, the chart of Dow Jones Industrial Average is showing its own version of this topping process that could take the Dow down toward 12000 on its Broadening Top that confirms at 12711 with the Bear Pennant’s target of 12704 providing the bearish spark, perhaps, to the Dow’s Broadening Top.

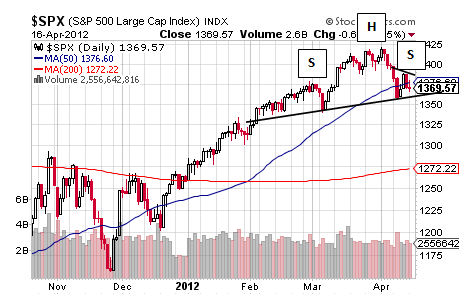
Equally unsurprising is the fact that the S&P is showing less of that Broadening Top and much more of the H&S cousin that is peeking out of the Nasdaq Composite’s chart too with the S&P’s H&S confirming at 1357 for a target of 1292 and it is a pattern that should be taken seriously so long as the S&P remains below 1402.
And it is the 5%+ decline objective of the S&P’s time-taking topping process, then, that suggests treating the index, and risk, with care.

This process started back in early March when the Russell 2000 dove for its 50 DMA and something that seemed to signal a 200 DMA dash-to-come and an event that seems increasingly likely as the Russell 2000 hangs below its flattening 50 DMA with a Broadening Top standing by to take this small cap index well below its 200 DMA. However, there is the possibility that the Russell 2000 visits the top trendline of that pattern one more time before potentially making a proper downside break by dropping below 784 for a current target of 720 and well below its 200 DMA and this speaks to the idea that topping is a process and not a point.
One reason to think that process may accelerate in the days ahead, though, is shown by the Russell 2000’s recent consolidation into what appears to be a Bear Pennant that carries, interestingly, the same 720 target on confirmation of 784 and it remains valid unless the Russell 2000 climbs above $828. One reason to have faith in that Bear Pennant is shown by the Nasdaq Composite’s own Bear Pennant that is working ferociously to confirm.

The Nasdaq Composite’s Bear Pennant confirms on a closing basis at 2987 for a target of 2846 and it remains valid so long as the Nasdaq Composite is below 3086 with its own Broadening Top giving reason to think it will remain valid considering that the pattern confirms at 2885 for a target of 2636.

Not surprisingly, the chart of Dow Jones Industrial Average is showing its own version of this topping process that could take the Dow down toward 12000 on its Broadening Top that confirms at 12711 with the Bear Pennant’s target of 12704 providing the bearish spark, perhaps, to the Dow’s Broadening Top.

Equally unsurprising is the fact that the S&P is showing less of that Broadening Top and much more of the H&S cousin that is peeking out of the Nasdaq Composite’s chart too with the S&P’s H&S confirming at 1357 for a target of 1292 and it is a pattern that should be taken seriously so long as the S&P remains below 1402.
And it is the 5%+ decline objective of the S&P’s time-taking topping process, then, that suggests treating the index, and risk, with care.
