Alcoa (NYSE:AA) had a tough start to 2016.
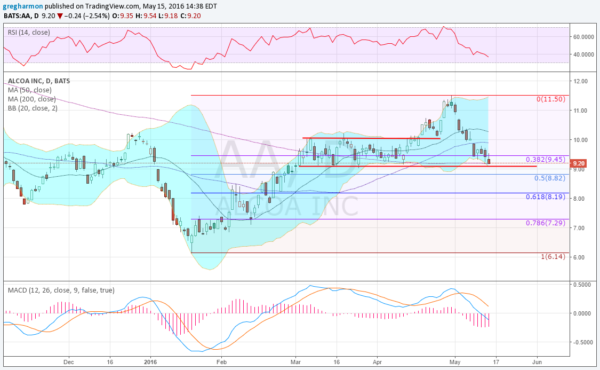
It fell 40% from its December 29th high to the low January 20th, just 3 weeks later. But following that, the stock rebounded back to those December highs, and after a 6-week consolidation, to a higher high at the end of April.
It has pulled back from that high as well, and has the look of more downside to come.
The price area between 9.10 and 10 has played an important role lately. The consolidation took place there. And now the pullback is approaching the bottom of that range.
In the middle of that range is the 38.2% retracement of the move from the February low to the April high, often a key retracement.
Momentum is pointing to the downside. The RSI is falling into the bearish zone with a move under 40 and the MACD has gone negative. The Bollinger bands are opening lower, allowing more downside as well.
Short interest is high in Alcoa, at 11.5%. There was also a golden cross printed, with the 50 day SMA crossing up through the 200 day SMA in mid April.
In sum, the chart shows many reasons to look for lower prices,m but minding the high short interest and near-term support. What do the options chains suggest?
For May expiry, the biggest open interest is at the 11 strike on the call side. Looking at both puts and calls, both the 10 and 11 strikes are biggest, suggesting maximum pain this week with a close at 10.50.
There is large open interest at the 8 strike put as well. Next week the open interest aligns near the money at the 9.5 strike.
Moving out to June expiry, the open interest weighs heavily to the downside. The 8 strike has nearly 120,000 contracts. The 14 strike and 6 strike are less than half of that and then the 10 strike drops even further.
Finally the July contract, just beyond the next earnings report, is mixed. Calls outweigh puts by about 11 to 3. There is very large open interest at both the 8 and 11 strike calls, creating some confusion.
So options traders are on balance looking for downside beyond this week, possibly giving way to the upside at earnings in mid July.
Alcoa
Trade Idea 1: Sell the stock short on a move under 9.10 with a stop at 9.35.
Trade Idea 2: Buy the May/June 9 put calendar for 30 cents.
Trade Idea 3: Buy the July 9/11 call spread (67 cents) and sell 2 of the June 10 calls for 21 cents.
Trade Idea 4: Buy the June 9/8 1×2 put spread for 19 cents.
Trade Idea 5: Buy the stock (over 9) and buy a June 9/8 put spread (31 cents) selling a July 11 call (19 cents), a net of 12 cents for the collar.
The first trade is to take advantage of continued weakness short-term in the stock. Trade 2 looks for that weakness but not before holding at 9 this week. Trade 3 looks for a run higher into earnings but not above 10 in June. Trade 4 looks for downside into June expiry but not below the largest open interest at 8. Finally, trade 5 is buying the stock with protection through the projected June weakness from the options open interest, and then a run higher into earnings.
Which idea suits your style?
After reviewing over 1,000 charts, I have found some good setups for the week, including Alcoa above. These were selected and should be viewed in the context of the broad Market Macro picture reviewed Friday, which heading into May options expiration sees the equity markets continuing to look weak.
Disclaimer: The information in this blog post represents my own opinions and does not contain a recommendation for any particular security or investment. I or my affiliates may hold positions or other interests in securities mentioned in the Blog, please see my Disclaimer page for my full disclaimer.
