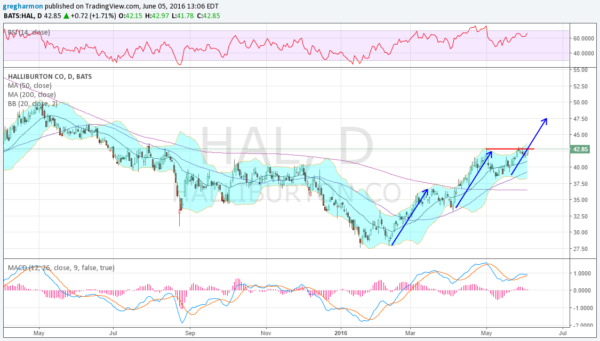
Halliburton (NYSE:HAL) started lower with oil prices in July 2014. The pace of decline slowed in 2015 and it found a bottom in February 2016. In fact it was a double bottom, as it is now confirmed with a move over the October and November 2015 consolidation area.
In April the price also pushed over the 200 day SMA for the first time since October 2014. This was followed in May with a golden cross, the 50 day SMA crossing up through the 200 day SMA.
The price action is building a 3 wave pattern now that targets 47.50 on the third leg. This would be confirmed on a move over the May 2nd high. It has support to move up from the rising and bullish RSI and the rising MACD. The Bollinger Bands® are also opening to the upside. That would put the stock within a stone’s throw of the May 2015 high at 50.
There is resistance along the way at 42.95 and 44.50, followed by 46.40 then 48.15 and 50. Support lower comes at 41.50 and 40 followed by 38.60. Short interest is low at 2.8% and the company is expected to report earnings next on July 20th.
The options chains show most of the open interest this week below the current price. The call side is biggest at 42 and the put side from 41 to 41.50. In the June monthly expiry, the largest open interest is above at the 44 strike calls with big size at the 42 call as well and then smaller at the 40 put.
The July monthly expiry is also largest on the call side, this time at 42 and then 41, but all the put action below from 41 to 35. The July 22 expiry, the first after the earnings report, is just starting to build.
Finally, the August open interest is also small relative to June and July, but focused below the current price.

Trade Idea 1: Buy the stock on a move over 43 with a stop at 41.25.
Trade Idea 2: Buy the stock and add a July 22 expiry 42.5/40 put spread (offered at 90 cents) and sell a July 22 expiry 46 covered call (54 cents).
Trade Idea 3: Buy a July 42 call and sell a June 44 call ($1.71) for a call diagonal.
Trade Idea 4: Buy a July 40/42/46 bullish call spread risk reversal ($1.06).
Trade Idea 5: Sell a June 43 straddle ($1.67) and buy a July 22 expiry 43 straddle ($3.59).
Trade 1 is a straight stock buy and Trade 2 adds protection with a collar, though earnings for an extra 36 cents. Trade 3 looks for the upside with the large open interest in June options to hold it at 44 next week, then continue. Trade 4 looks for a run up into earnings and for the stock to remain over 40 along the way. Trade 5 looks to give an earnings set up to move either way with nearly half the cost funded if it does not move much the next 2 weeks.
