Financial Companies Review:
In our previous article we made an overview of the financial sector and we mentioned that the overall performance was below average as most of the 'Top Financial Companies' stocks were in the negative territory since the start of 2016. The acceleration to the upside came during the 4th quarter of the year after the US Election which was as always a driving event as the lows was already in place few days before it. Our dark horse Comerica (NYSE:CMA) continued its outstanding performance closing the year for a record of +65% and the stock is approaching a break above 1998 peak which will make the financial services company even more bullish in the coming years. 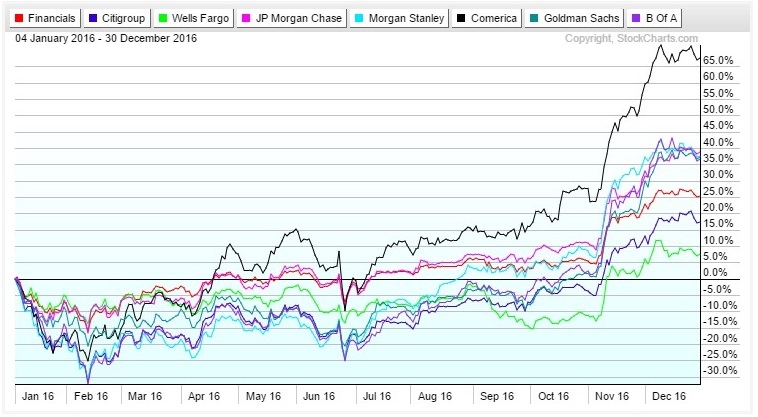
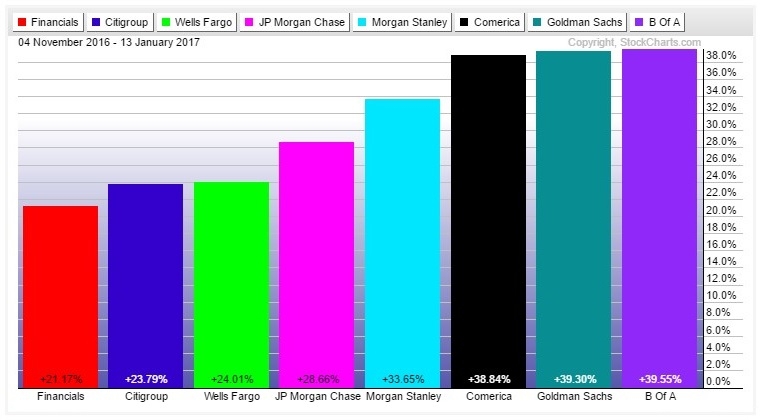
The so called " Trump Rally " helped the stock market to make it's best rally since the 2008 crisis and the financial sector was the one leading the move with its major companies gains hovering around +20% and +40% since last November lifting confidence around Investors which is always a good sign for the Economy. So if you missed this strong move and still seeking a way to join the bulls don't worry too much as there will always be an opportunity around the corner and you only need to wait for the right setup to take it.
You may have noticed that Berkshire Hathaway (NYSE:BRKa) (NYSE:BRKb) (Top Holder of XLF with 10.74%) was left out of the recent charts even it also finished the year with a double digit positive number but the recent rally was a bit slower than the rest. Warren Buffet claimed that purchasing its multinational conglomerate holding company 45 years ago was the biggest investment mistake he had ever made , as if he had invested the money directly in insurance businesses instead of buying out Berkshire Hathaway, those investments would have paid off more billions! The company is one of the fewest Financial Companies that keeps making new all time highs (like JPMorgan Chase and Co (NYSE:JPM)), unlike others still recovering from the financial crisis which tell us a lot about how strong the bullish trend is. So let's jump to the Elliott wave technical chart to understand the current situation in the financial sector and if Berkshire Hathaway could still represent an investment opportunity.
Financial Select Sector SPDR (NYSE:XLF) Monthly Charts
XLF is still trading below 2007 peak but with the recent brake above 2015 highs it opened an extension to the upside which means that the instrument is now showing 5 swing incomplete bullish sequence calling for a move to equal legs area at 31.02 - 34.80 which clearly take it for new all time highs. As usual, the move higher won't be in a straight line so XLF should be ending the cycle from 2015 and 2016 lows around 24.91 - 27.24 area before a pullback against 15.04 can be seen, that corrective move should represent a long term buying opportunity in various financial companies that belong to XLF. 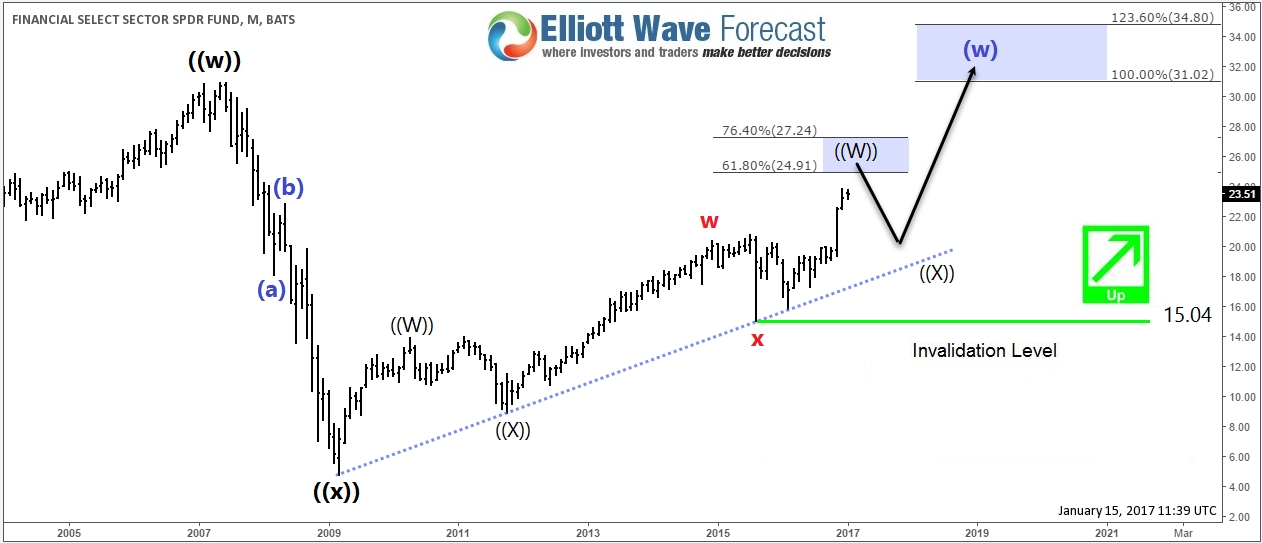
We also need to keep in mind that the move from 2009 can also be counted as a triple three structure and reaching the equal legs area 24.11 - 26.26 will trigger a larger pullback for XLF meaning if 2015 pivot at 15.04 low breaks, the instrument would be seeing a larger pullback in 3 waves against the 2009 low at 4.77 before bouncing higher again . 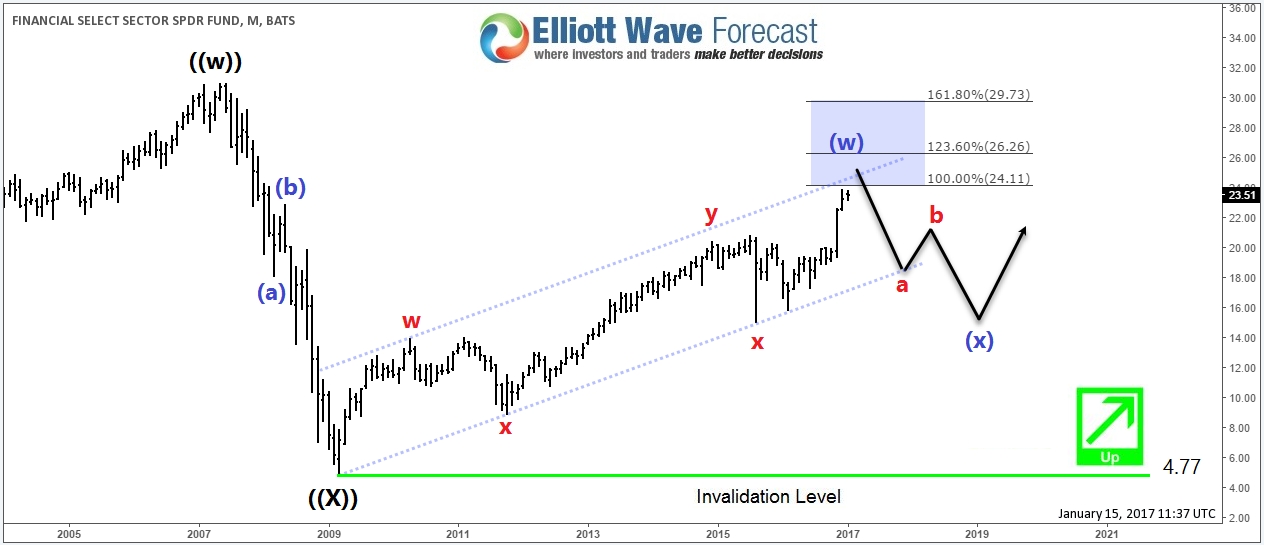
Consequently, XLF remain bullish in the longer term looking for new highs. However in the near term, the common area for both scenarios around 24 - 26 could representing a turning point where the financial stocks would see a corrective move to the downside.
Berkshire Hathaway (BRKb) Weekly Charts
With the recent break above 2014 peak, BRKb made a new all time high looking for more extension to the upside that's why we are looking for a short term entry for the stock around the 50%-61.8% Fibonacci retracement area ($154.55 - $151.52). The Stock needs to hold above the bullish trend-line and most importantly October pivot at $141.92 low needs to remain intact so a bounce in 3 waves at least can be seen . 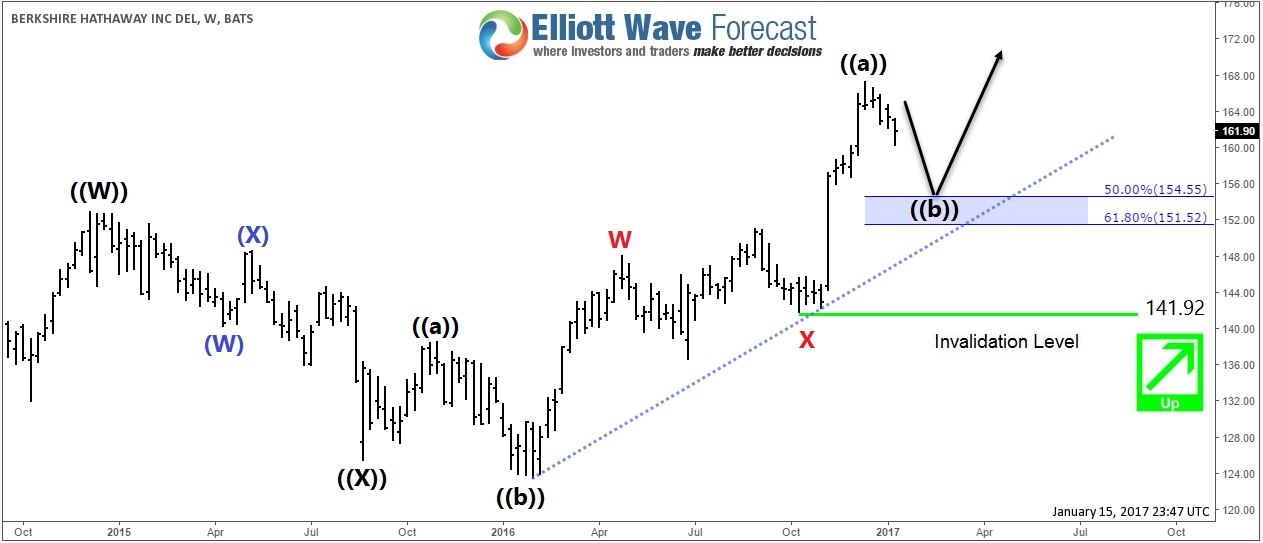
If the bounce fails to make new highs then BRK.B could have ended 2016 cycle and doing a larger 3 waves pullback against February 2016 low $123.55 which means the stock will visit the $145.33 - $140.12 before resuming its bullish trend. The move in Berkshire Hathaway could be leading the rest of financial stocks as it already ended October cycle but with XLF still missing another leg higher, short term pullbacks can still represent a good risk / reward trading opportunity . 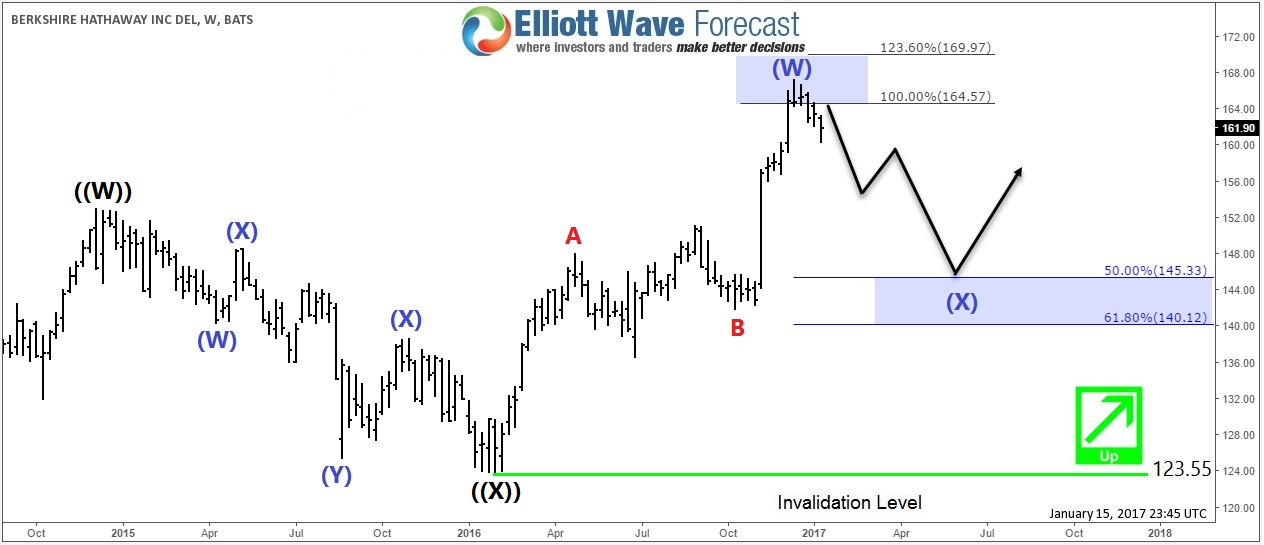
Recap : It's never too late to join a bull market if you carefully choose the right time to invest in a bullish stock, that's why you need a very good technique that will allow you to be in the right side of the market and trade with the minimum risk. Constantly, if you are still fan of Warren Buffet company you can look to buy the next corrective pullback of the stock or you can wait for the next long term opportunity in the financial sector XLF among its financial companies as explained above.
