Currently there are only 5 significant ETFs in the preferred and convertible ETF sector. More may be issued especially as the drive for yield heats up with baby boomers heading toward retirement and lingering distrust of equity market conditions.
Preferred shares are senior to common stock and entitled to dividends ahead of the former. Many have credit ratings like bonds. These shares also protect investors to a limited extent in the event of a company liquidation or merger. Also preferred stock may have a redemption clause (callable) beneficial to the company issuing them.
These callable factors would generally limit the appreciation normally seen with common stocks. The trade-off is a higher current yield. Further, in the event a company seeks to issue more preferred shares in the future at a price lower than existing issues the price will be lowered on the subsequent stock sale.
Preferred stocks may be an attractive alternative financing tool for corporations. This may allow companies to go into arrears without a penalty common to bond issues. Preferred issues may be in place to prevent a hostile takeover.
Banks may use preferred shares as a form of Tier 1 capital which is the core measure of a bank’s financial strength. This generally consists of common stock and disclosed reserves but may include various preferred stock shares.
Some preferred shares may have any or all of the following attributes: a voting rights agreement; registration rights; the right to receive financial statements; preemptive rights on future stock financings, and rights of first refusal on sales of founder stock.
As we’ve seen with an investor like Warren Buffet, he has asked for and received a special class of convertible preferred shares particularly when investing in troubled companies like Goldman Sachs (GS) and Bank of America (BAC) as historic examples. Of course, these are shares issued exclusively to his Berkshire Hathaway company and unavailable to the general investing public other than through BRK/A or B.
Financials and banks currently dominate the holdings of ETFs in the preferred space. This should act as a note of caution. Previously public utilities dominated the space but they’re not represented in current indexes linked to ETFs.
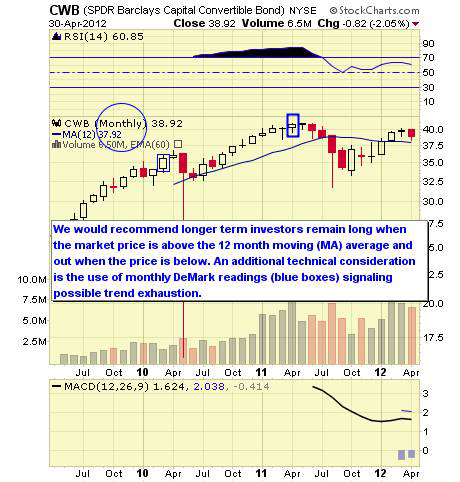
We feature a technical view of conditions from monthly chart views. Simplistically, we recommend longer-term investors stay on the right side of the 12 month simple moving average. When prices are above the moving average, stay long, and when below remain in cash or short. Some more interested in a fundamental approach may not care so much about technical issues preferring instead to buy when prices are perceived as low and sell for other reasons when high; but, this is not our approach.
For traders and investors wishing to hedge, leveraged and inverse issues are available to utilize from ProShares and Direxion and where available these are noted.![]()
CWB is linked to the Barclays Capital U.S. Convertible Bond > $500M Index which follows only those issues with issue sizes great than $500M.
The issue was launched in April 2009. The expense ratio is 0.40%. AUM equal $882.8M with average daily trading volume of 337.8K shares. The constituents include convertible bonds and preferred stocks. As of April 30, 2012 the annual dividend yield was 2.61% and YTD return 7.82%. The one year return was -6.24%
Data as of April 2012
CWB Top Ten Holdings and Weightings
· Wells Fargo & Co, San Francisco Ca Pfd: 4.25%
· General Mtrs Cv: 3.94%
· Citigroup Pfd: 3.23%
· Bk Amer Pfd: 3.08%
· E M C Corp Mass Cv 1.75%: 2.82%
· Metlife: 2.60%
· Intel 144A Cv 3.25%: 2.60%
· Amgen Cv 0.375%: 2.41%
· Medtronic Cv 1.625%: 2.10%
· Chesapeake Engy Cv 2.5%: 2.04%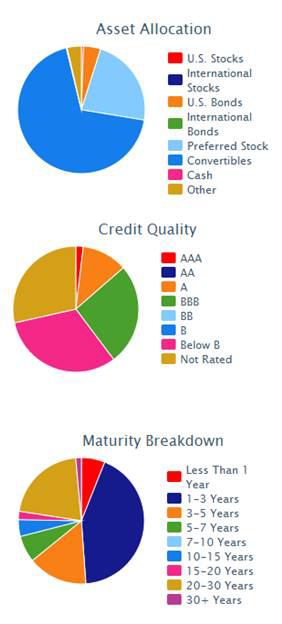
![]()
PSK follows the Wells Fargo Hybrid and Preferred Securities Aggregate Index which is a modified market capitalization weighted index composed of preferred stock and securities that are functionally equivalent to preferred stock including, but not limited to, depositary preferred securities, perpetual subordinated debt and certain securities issued by banks and other financial institutions that are eligible for capital treatment with respect to such instruments akin to that received for issuance of straight preferred stock.
The fund was launched in September 2009. The expense ratio is 0.45%. AUM equal $200M and average daily trading volume is 49.8K shares. As April 30 2012 the annual dividend yield is 5.31% and YTD return 6.88%. The one year return was 3.09%.
Data as of April 2012
PSK Top Ten Holdings and Weightings
· Barclays Bank Plc (BCS.PD): 2.27%
· Hsbc Hldgs Pfd: 2.20%
· Wells Fargo & Co, San Francisco Ca Pfd: 2.03%
· Credit Suisse Guernsey Brh Pfd: 1.81%
· Metlife Pfd: 1.73%
· Deutsche Bk Contingent Cap Tr Iii Pfd: 1.55%
· Goldman Sachs Grp Pfd: 1.53%
· Ing Groep N V Pfd: 1.43%
· Us Bancorp Del Pfd: 1.37%
· Wells Fargo Cap Xii Pfd: 1.33%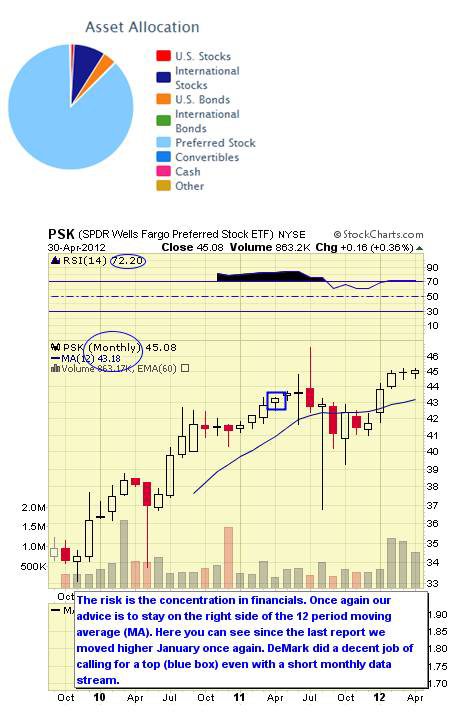
![]()
PGX tracks the BofA Merrill Lynch Core Fixed Rate Preferred Securities Index. The fund was launched in January 2008. The expense ratio is lower at 0.50%. AUM equal $1.6M and average daily trading volume is 544K shares.
As of April 2012 the annual dividend yield is 6.50% and YTD return was 7.09%. The one year return was 6.22%.
Data as of April 2012
PGX Top Ten Holdings and Weightings
· Wells Fargo & Co, San Francisco Ca Pfd: 4.68%
· Citigroup Cap Xiii Pfd: 4.49%
· Barclays Bank Plc (BCS.PD): 4.22%
· Jpmorgan Chase Pfd: 3.81%
· Citigroup Cap Xii Pfd: 3.78%
· Hsbc Hldgs Pfd: 3.46%
· Morgan Stanley Cap Tr Vii Pfd: 3.44%
· Ing Groep N V Pfd: 3.18%
· Bk Amer Pfd: 3.08%
· Hsbc Hldgs Pfd: 3.01%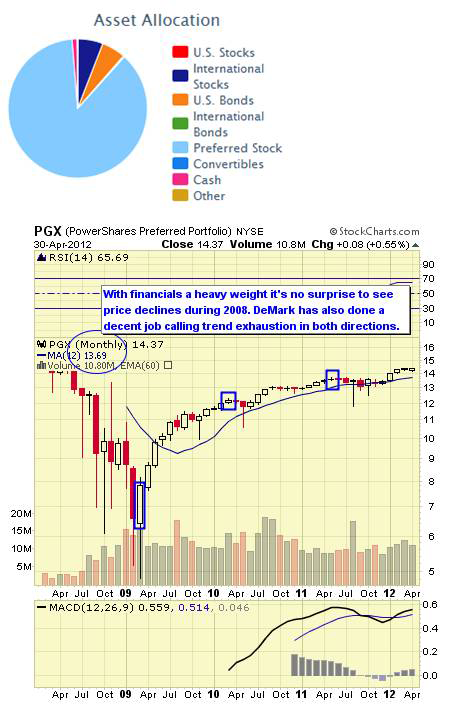
![]()
PGF tracks the Wachovia Hybrid & Preferred Securities Financial Index. The fund was launched in December 2006. The expense ratio is 0.60%. AUM equals $1.6M and average daily trading volume is roughly 358K shares. Quality ratings put most of the assets in the A to BB category. As of April 2012 the annual dividend yield was 6.85% and YTD return 13.25%. The one year return was 5.20%.
Data as of April 2012
PGF Top Ten Holdings and Weightings
· Hsbc Hldgs Pfd: 9.61%
· Bk Amer Pfd: 7.32%
· Ing Groep N V Pfd: 5.43%
· Hsbc Hldgs Pfd: 5.30%
· Bk Amer Pfd: 4.55%
· Credit Suisse Guernsey Brh Pfd: 4.26%
· Wells Fargo & Co, San Francisco Ca Pfd: 4.17%
· Jpmorgan Chase Pfd: 4.09%
· Metlife Pfd: 4.02%
· Ing Groep Nv Pfd: 3.90%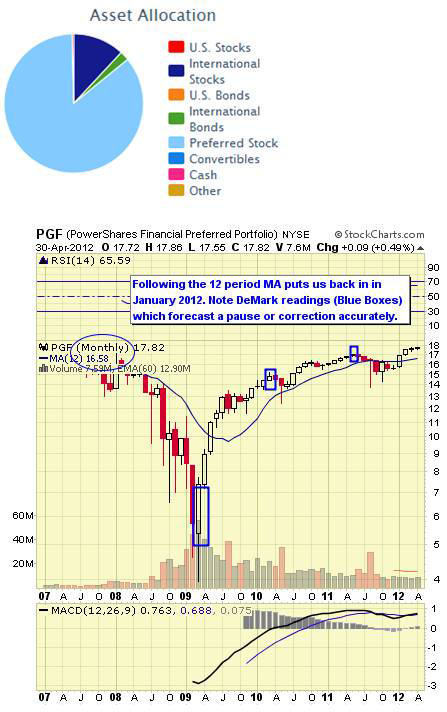
![]()
PFF tracks the index described parenthetically. The Fund was launched in March 2007. The expense ratio is 0.48%. AUM equal $8.4M with an average daily trading volume of 1.4M shares. As of April 2012 the annual dividend yield is currently 4.69% and YTD return 9.21%. The one year return was 2.14%.
Typically, with most preferred issues you’ll find mostly financial company names as index constituents. PFF is no different with nearly 85% of holdings from financial companies. This concentration is a risk factor investors need to consider.
Data as of April 2012
PFF Top Ten Holdings & Weightings
· HSBC Hldgs Pfd: 2.59%
· General Mtrs Cv: 2.35%
· Barclays Bank PLC (BCSPRD): 1.64%
· Wells Fargo & Co, San Francisco Ca Pfd: 1.61%
· Citigroup Cap Xii Pfd: 1.52%
· Citigroup Cap Xiii Pfd: 1.52%
· HSBC Hldgs Pfd: 1.47%
· Bank Amer Pfd: 1.43%
· JP Morgan Chase Cap Xxvi Pfd: 1.29%
· GMAC Cap Tr I Pfd: 1.28%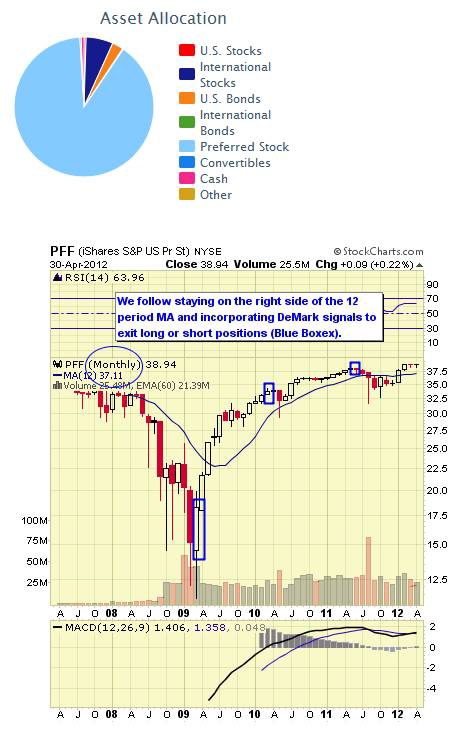
The sector is primarily for yield hungry investors of which there is a growing segment. The sector has recovered from its recent lows from the fall of 2011.This is due to more confidence in the economy that may be turning higher encouraging bulls believing financials in particular have bottomed. But we’ve seen this before and how long this belief will last is uncertain.
Rankings Explained
We rank the Top ETFs by our proprietary stars system as outlined below. However, given that we’re sorting these by both short and intermediate issues we have split the rankings as we move from one classification to another.![]()
Strong established linked index
Excellent consistent performance and index tracking
Low fee structure
Strong portfolio suitability
Excellent liquidity![]()
Established linked index even if “enhanced”
Good performance or more volatile if “enhanced” index
Average to higher fee structure
Good portfolio suitability or more active management if “enhanced” index
Decent liquidity![]()
Enhanced or seasoned index
Less consistent performance and more volatile
Fees higher than average
Portfolio suitability would need more active trading
Average to below average liquidity![]()
Index is new
Issue is new and needs seasoning
Fees are high
Portfolio suitability also needs seasoning
Liquidity below average
It’s also important to remember that ETF sponsors have their own competitive business interests when issuing products which may not necessarily align with your investment needs. New ETFs from highly regarded and substantial new providers are also being issued. These may include Charles Schwab’s ETFs and Scottrade’s Focus Shares which both are issuing new ETFs with low expense ratios and commission free trading at their respective firms. These may also become popular as they become seasoned.
Disclosure: Long positions in PFF and PGF in various portfolios.
(Source for data is from ETF sponsors and various ETF data providers)
- English (UK)
- English (India)
- English (Canada)
- English (Australia)
- English (South Africa)
- English (Philippines)
- English (Nigeria)
- Deutsch
- Español (España)
- Español (México)
- Français
- Italiano
- Nederlands
- Português (Portugal)
- Polski
- Português (Brasil)
- Русский
- Türkçe
- العربية
- Ελληνικά
- Svenska
- Suomi
- עברית
- 日本語
- 한국어
- 简体中文
- 繁體中文
- Bahasa Indonesia
- Bahasa Melayu
- ไทย
- Tiếng Việt
- हिंदी
Top 5 Preferred Stock ETFs
Latest comments
Loading next article…
Install Our App
Risk Disclosure: Trading in financial instruments and/or cryptocurrencies involves high risks including the risk of losing some, or all, of your investment amount, and may not be suitable for all investors. Prices of cryptocurrencies are extremely volatile and may be affected by external factors such as financial, regulatory or political events. Trading on margin increases the financial risks.
Before deciding to trade in financial instrument or cryptocurrencies you should be fully informed of the risks and costs associated with trading the financial markets, carefully consider your investment objectives, level of experience, and risk appetite, and seek professional advice where needed.
Fusion Media would like to remind you that the data contained in this website is not necessarily real-time nor accurate. The data and prices on the website are not necessarily provided by any market or exchange, but may be provided by market makers, and so prices may not be accurate and may differ from the actual price at any given market, meaning prices are indicative and not appropriate for trading purposes. Fusion Media and any provider of the data contained in this website will not accept liability for any loss or damage as a result of your trading, or your reliance on the information contained within this website.
It is prohibited to use, store, reproduce, display, modify, transmit or distribute the data contained in this website without the explicit prior written permission of Fusion Media and/or the data provider. All intellectual property rights are reserved by the providers and/or the exchange providing the data contained in this website.
Fusion Media may be compensated by the advertisers that appear on the website, based on your interaction with the advertisements or advertisers.
© 2007-2025 - Fusion Media Limited. All Rights Reserved.
