The euro bulls repelled the bears' attack yesterday though the bears are again making headway. Will they be able to break through today? The Philadelphia Fed Manufacturing Index surprised on the upside, lending support to the U.S. currency. Our short euro position became more profitable in return. How does our other open position do? Just great. We have also identified a prospective candidate for opening a brand new position. Get ready!
EUR/USD - Downside Momentum Is Building

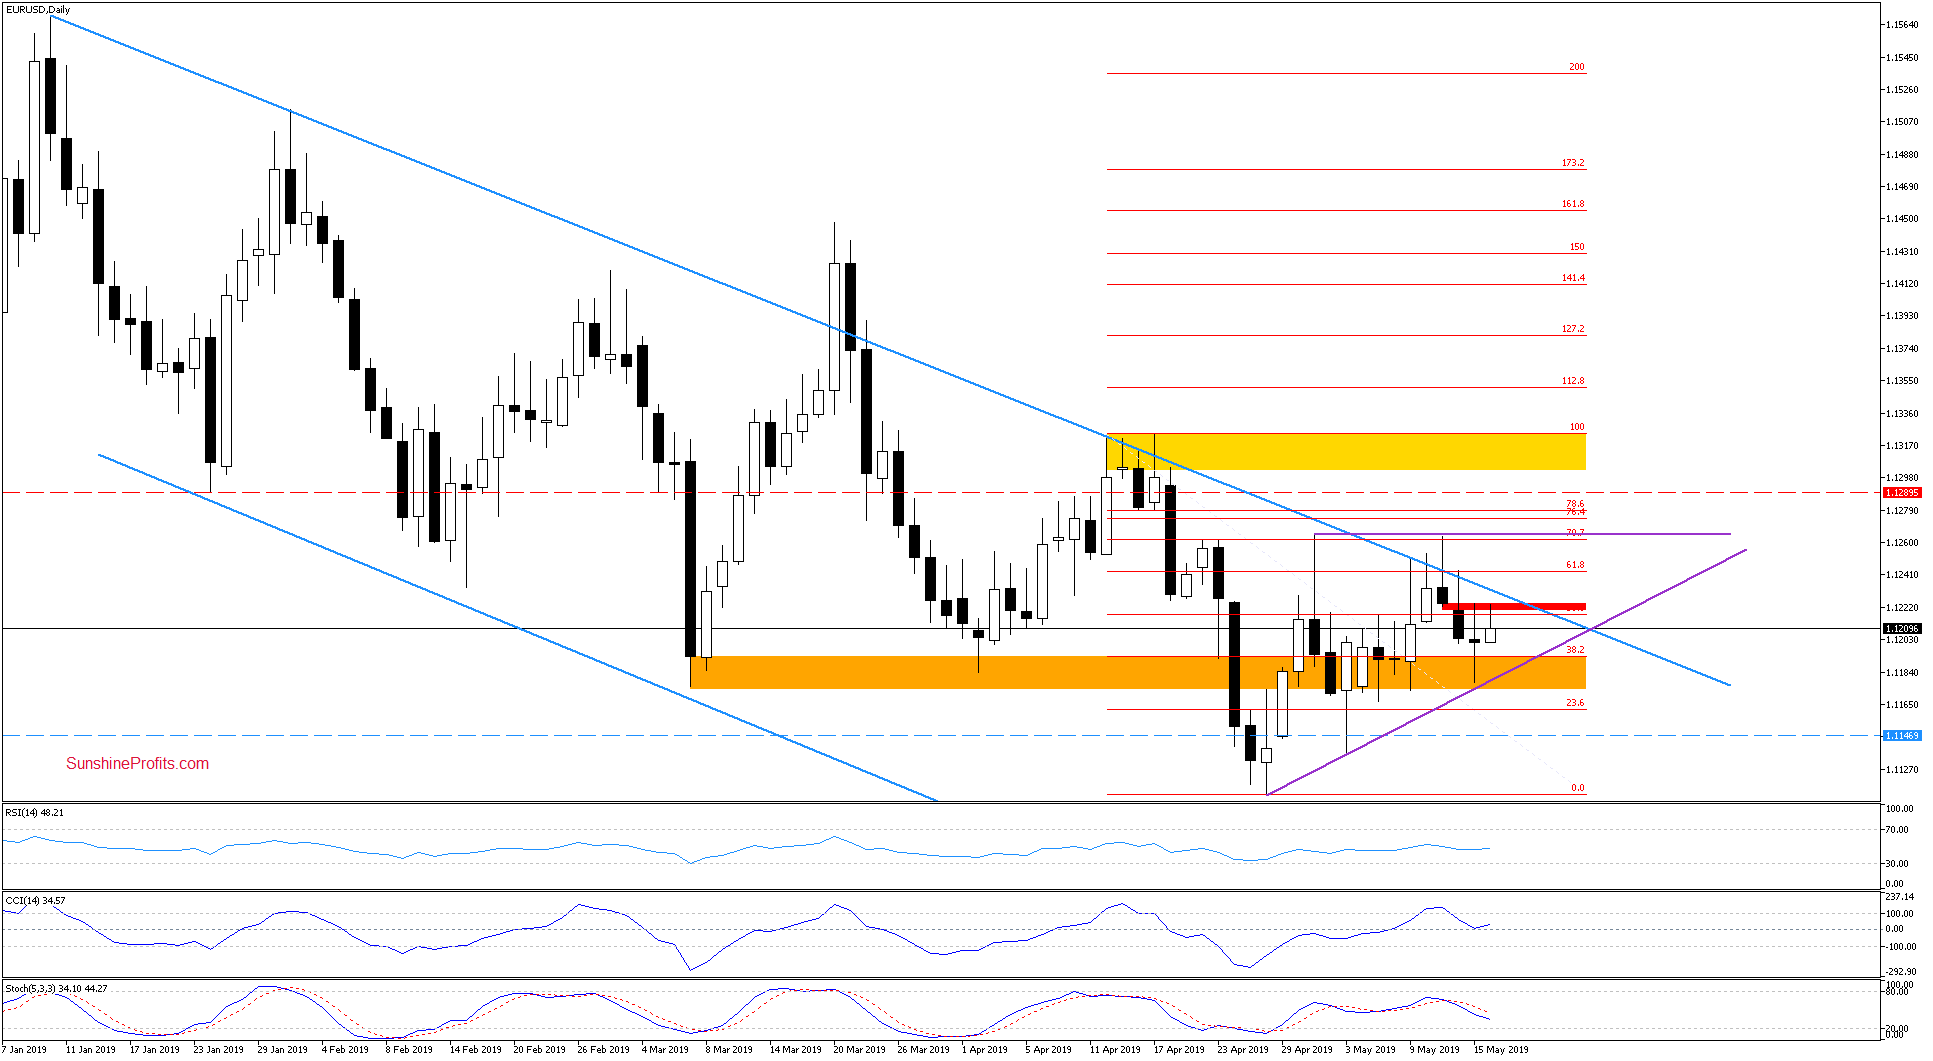
EUR/USD has certainly moved lower yesterday. The bears took the rate almost to the rising purple support line, close to the lower border of the orange support zone. The combination of these factors spurred the bulls into action and the pair closed the day with only slight losses.
Earlier today, the bulls have been building upon yesterday's momentum and took the pair to the gap as marked by the red horizontal zone. This line is keeping their gains in check. This is a reversal and it's sending the pair lower to below 1.1200 currently.
Let's see the daily indicators now. They' re still on their sell signals, supporting the sellers. This suggests that another move to the downside is just around the corner. Should we see such price action, the sellers' first target would again be the rising purple support line. If that´s broken, then our initial downside target is the second objective.
USD/CAD - Testing the Lower Border of the Consolidation

We have written on Tuesday these words about the combination of major short-term resistances:
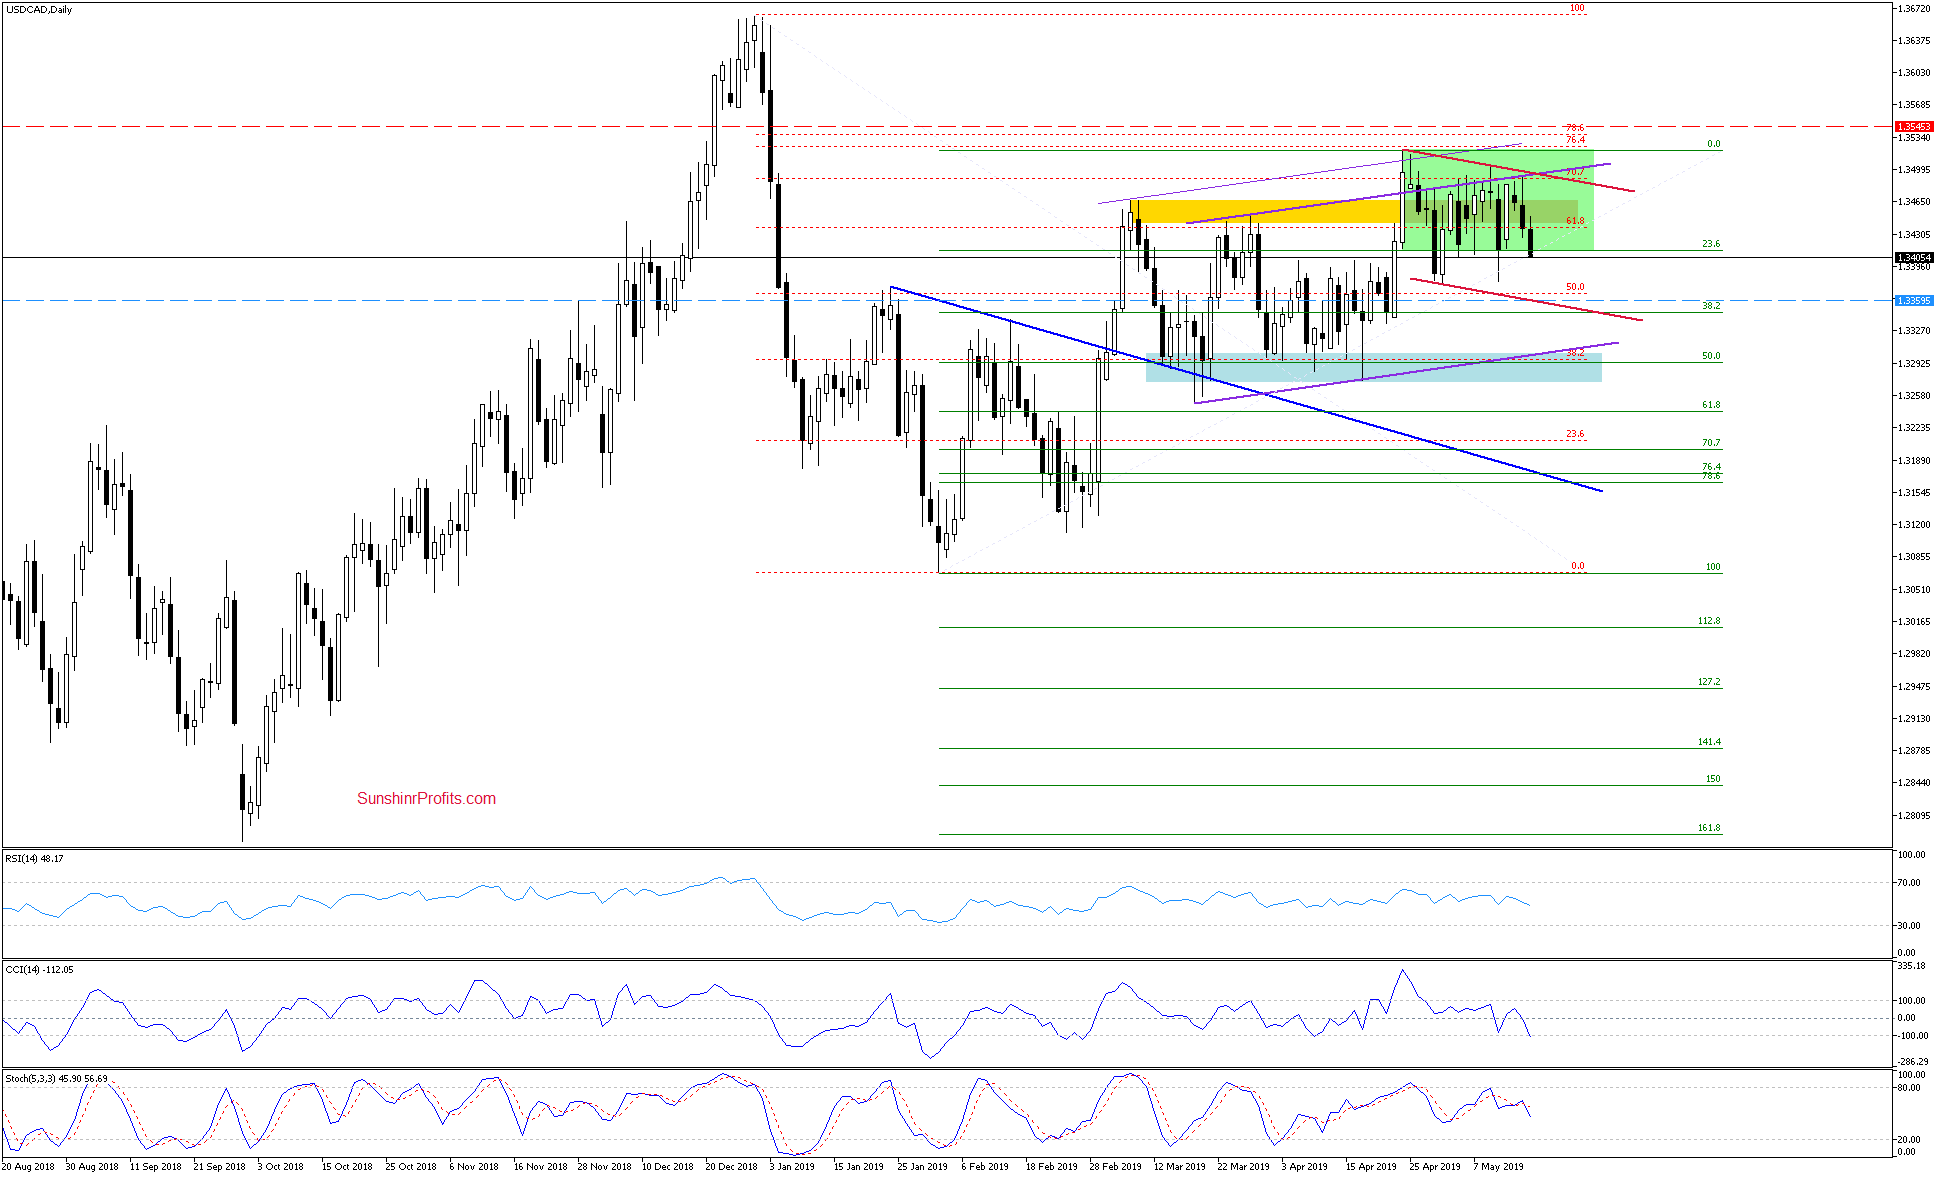
(..) This resistance is marked by the combination of the 70.7% Fibonacci retracement, the upper border of the purple rising trend channel, the previous highs and the upper border of the red declining trend channel.
In all previous instances, the bulls haven't had much success breaking higher. It increases the likelihood of seeing another reversal down the road this time, too. Lower USD/CAD values remain likely in the very near future.
The pair has turned south, making our short position even more profitable earlier today. The pair is trading at around 1.3420 as we speak. Should the bears push the rate below the lower border of the green consolidation on a closing basis, we're likely to see further deterioration. A test of the recent lows, the 38.2% Fibonacci retracement, or even the lower line of the red declining trend channel is not out of the question in the coming days.
AUD/USD - Stabilizing at Support?

In our Tuesday's commentary on this pair, we have questioned how low can the bears bring the price down:
(...) How far down could the bears take the pair?
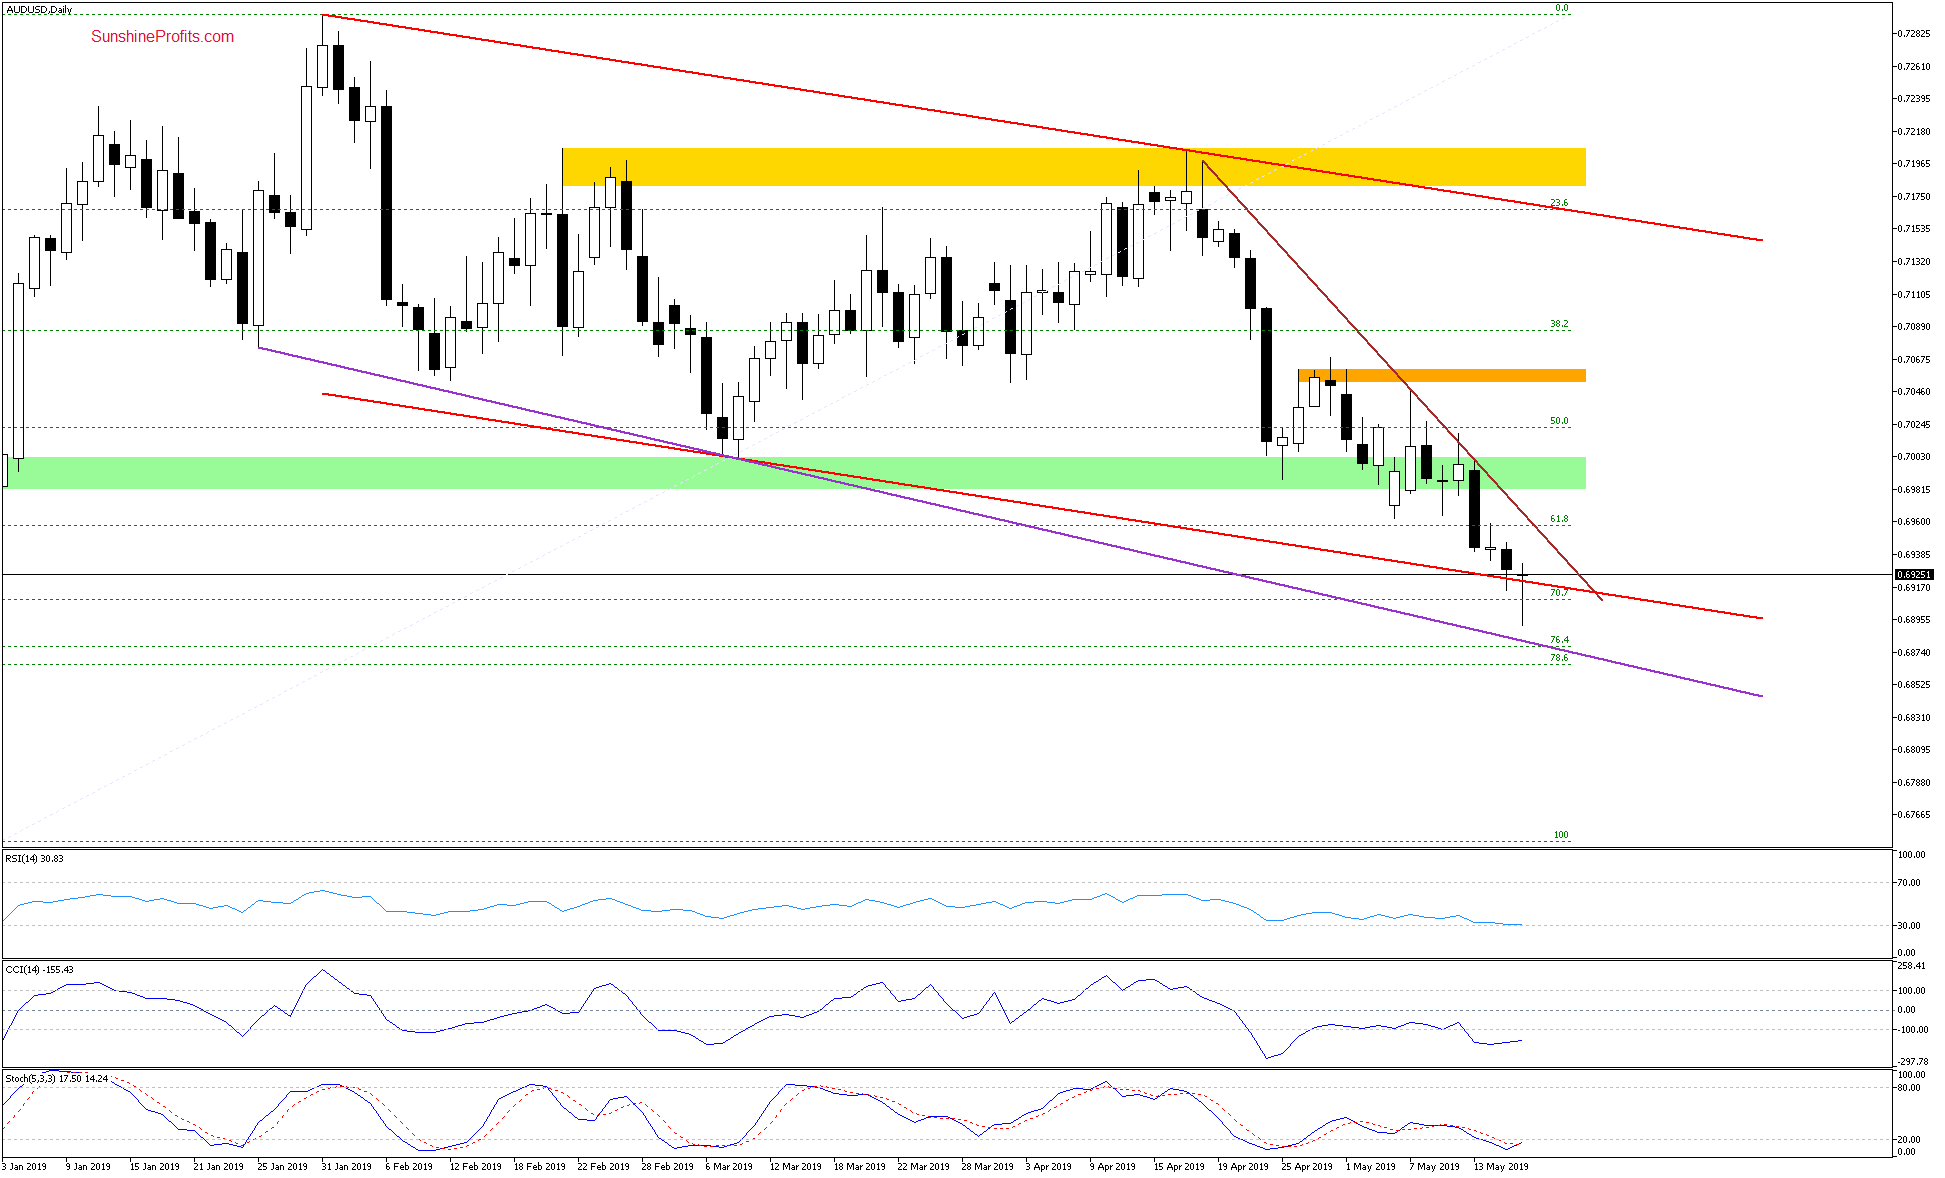
Actually, not that far it seems. Look at the lower border of the red declining trend channel and then the 70.7% Fibonacci retracement. Additionally, the RSI approached the level of 30, while the CCI and the Stochastic Oscillator moved to their oversold areas, increasing the probability of issuing buy signals in the following days.
The exchange rate went on to extend losses in the last few days and also broke below the lower border of the red declining trend channel on an intraday basis earlier today. The bulls have countered and the pair looks stabilized right now at the lower border of this trend channel.
This increases the likelihood of further improvements in the coming days. Additionally, the RSI flattened around the level of 30, the Stochastic Oscillator generated a buy signal, while the CCI keeps moving higher in its oversold area, increasing the probability of it also issuing a buy signal in the following days.
Connecting the dots, the downside momentum may be nearing its exhaustion. Should we see bullish signs such as a daily close comfortably above the lower border of the red declining trend channel and also a breakout above the brown declining resistance line, we'll consider opening long positions.
