
In the model swing trading portfolio of The Wagner Daily, seven of our eight ETF swing trades are presently showing unrealized price gains (no complaints there).
However, most of our current ETF positions are industry sector ETFs with a significant correlation to the direction of the main domestic stock market indexes.
As such, we are now seeking to add a bit of international ETF exposure to the mix, and we now have three Asian ETFs on our potential breakout watchlist: iShares South Korea (EWY), iShares Hong Kong (EWH), and PowerShares China (PGJ).
Korea Confirmation – EWY
When stalking stocks and ETFs for potential breakout buy entry, we always prefer to see confirmation on charts of multiple timeframes (as opposed to just the daily or weekly charts) because it increases the odds of a successful breakout that follows through to the upside.
EWY is one such ETF that fits the bill because it is setting up for potential breakout on the daily, weekly, and monthly charts (though the daily chart has not yet presented us with a low-risk buy entry point).
Below, the daily chart shows the recent bullish crossover signal when the 50-day moving average crossed above the 200-day moving average. The 200-day MA is beginning to trend higher as well.
This indicates a bullish reversal of the dominant trend: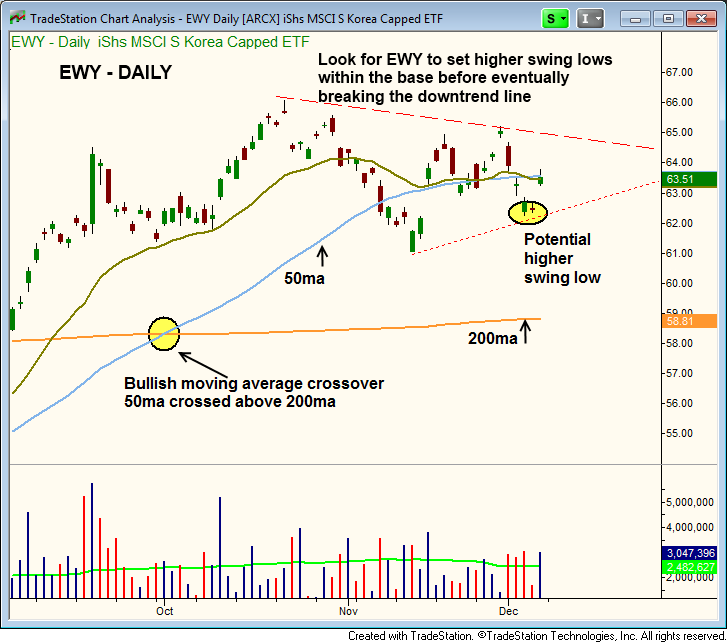
Notice that EWY is attempting to set its first “higher low” since pulling back in off the swing high in October.
Over the next week or two, we would like to see the price action tighten up around the 50-day moving average, which would present us with a low-risk buy entry point.
Zooming out to the weekly chart, we see the current base of consolidation that has formed right at the highs of 2012.
The current base is seven weeks old, and for the most part has held above the 10-week moving average (similar to the 50-day moving average).
From here, a breakout above the high of the seven-week base should produce enough bullish momentum to take out the highs of 2012: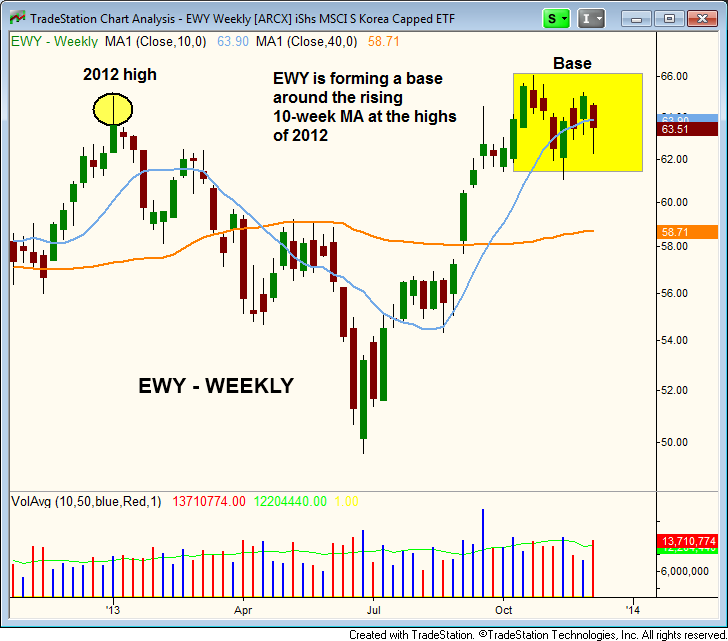
The long-term monthly chart below shows the tight price action of the past few months. A breakout above the 66 level should lead to a test of the 2011 high (around 70), and potentially a test of the 2008 high at 75: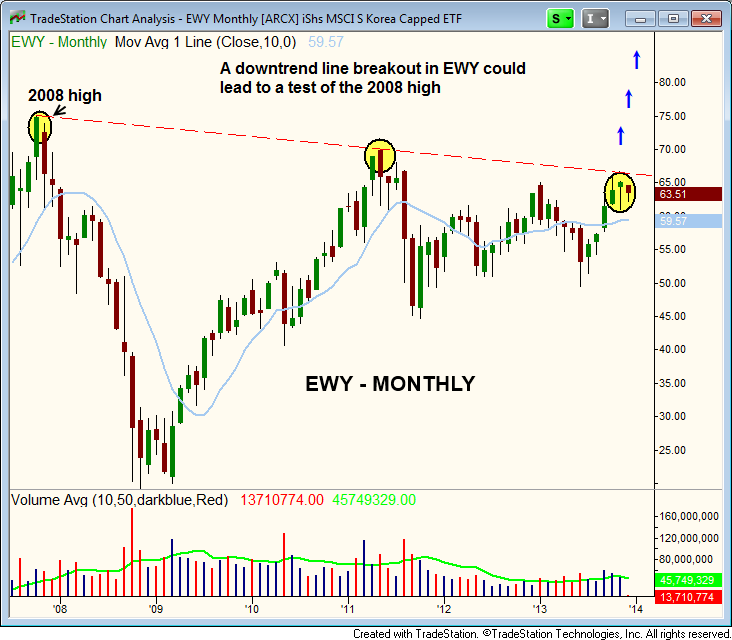
Hong Kong Crossover – EWH
After breaking down below the 40-week moving average (orange line below) during the summer, EWH popped back above the 40-week MA in September.
A few weeks later, the 10-week moving average (teal line) crossed above the 40-week moving average.
This is a known a bullish moving average crossover (which was also present on the daily chart of EWY).
As a sole technical indicator, this moving average crossover does not create a valid buy entry, but it shows that bullish price momentum is building in the right direction: 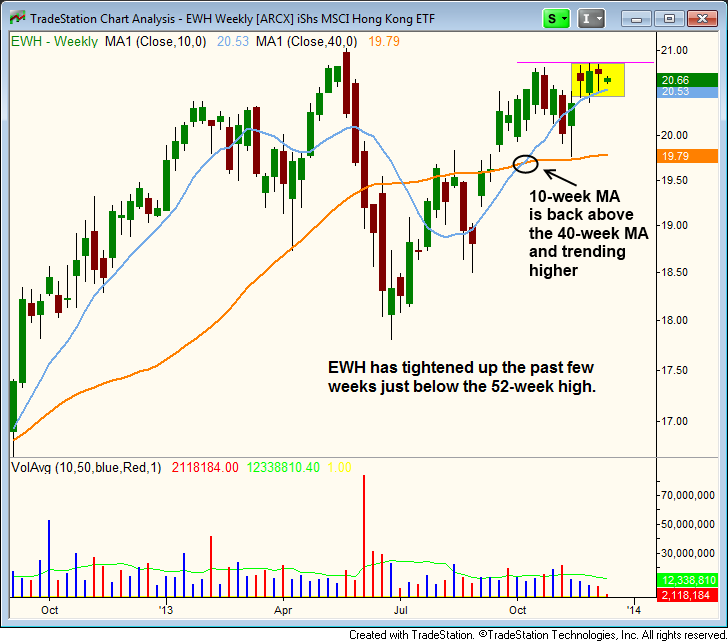
In addition to the 10-week moving average crossing above the 40-week moving average, notice that EWH has also formed a very tight range above its rising 10-week moving average (yellow rectangle).
If the price of EWH can continue to trade in a tight range, we should soon see a breakout to a fresh 52-week high.
Nevertheless, the price action needs to stay pretty tight because we do not want to see another test of the 40-week moving average (just below 20).
Chinese Contraction – PGJ
After an explosive run throughout this past summer, PGJ eventually ran out of gas and stalled out just above the 30 area.
However, it has since been forming a bullish and constructive base of consolidation (learn about the importance of basing action here).
On the daily chart below, notice that PGJ has mostly been holding above intermediate-term support of its 50-day moving average.
There were a few minor “undercuts” below that key moving average, but such price action is to be expected when a stock/ETF is basing out: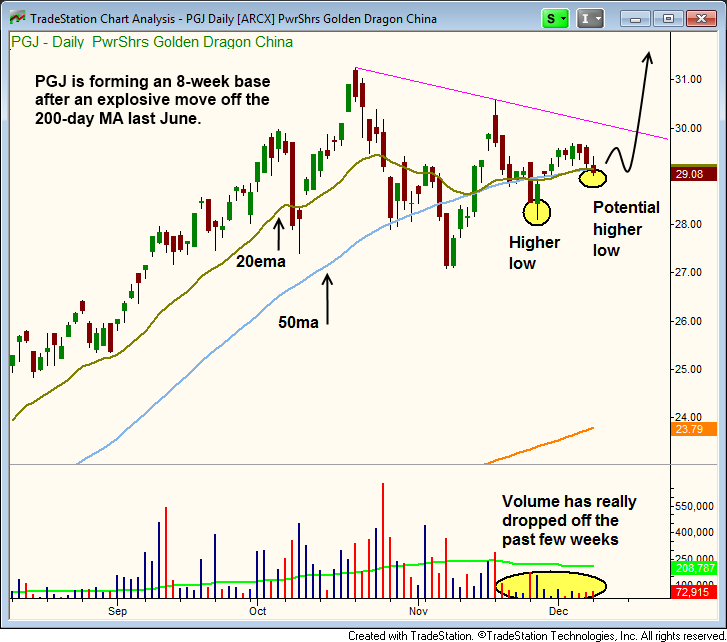
PGJ has already established a “higher low” within its base, and a second higher low could be in place by the end of the week.
While forming a base of consolidation, these higher lows and lower highs lead to a tightening of the price action (from the left side of base to the right), which is exactly what we want to see.
Overall, basing action is a pretty simple concept.
Volatility expands when the price begins to decline from the highs, then eventually contracts when a bottom starts to form (higher lows within the base).
After a few weeks of contracting volatility on lighter volume, volatility once again picks up when the stock/ETF eventually breaks out again and resumes its dominant uptrend.
Original post
- English (UK)
- English (India)
- English (Canada)
- English (Australia)
- English (South Africa)
- English (Philippines)
- English (Nigeria)
- Deutsch
- Español (España)
- Español (México)
- Français
- Italiano
- Nederlands
- Português (Portugal)
- Polski
- Português (Brasil)
- Русский
- Türkçe
- العربية
- Ελληνικά
- Svenska
- Suomi
- עברית
- 日本語
- 한국어
- 简体中文
- 繁體中文
- Bahasa Indonesia
- Bahasa Melayu
- ไทย
- Tiếng Việt
- हिंदी
Top 3 Asian ETFs Setting Up For Breakout Swing Trades
Published 12/10/2013, 11:47 PM
Updated 07/09/2023, 06:31 AM
Top 3 Asian ETFs Setting Up For Breakout Swing Trades
Latest comments
Loading next article…
Install Our App
Risk Disclosure: Trading in financial instruments and/or cryptocurrencies involves high risks including the risk of losing some, or all, of your investment amount, and may not be suitable for all investors. Prices of cryptocurrencies are extremely volatile and may be affected by external factors such as financial, regulatory or political events. Trading on margin increases the financial risks.
Before deciding to trade in financial instrument or cryptocurrencies you should be fully informed of the risks and costs associated with trading the financial markets, carefully consider your investment objectives, level of experience, and risk appetite, and seek professional advice where needed.
Fusion Media would like to remind you that the data contained in this website is not necessarily real-time nor accurate. The data and prices on the website are not necessarily provided by any market or exchange, but may be provided by market makers, and so prices may not be accurate and may differ from the actual price at any given market, meaning prices are indicative and not appropriate for trading purposes. Fusion Media and any provider of the data contained in this website will not accept liability for any loss or damage as a result of your trading, or your reliance on the information contained within this website.
It is prohibited to use, store, reproduce, display, modify, transmit or distribute the data contained in this website without the explicit prior written permission of Fusion Media and/or the data provider. All intellectual property rights are reserved by the providers and/or the exchange providing the data contained in this website.
Fusion Media may be compensated by the advertisers that appear on the website, based on your interaction with the advertisements or advertisers.
© 2007-2025 - Fusion Media Limited. All Rights Reserved.