There are currently over 50 U.S. Small-Cap issues whether categorized as growth, value or blend. This is overwhelming for most investors. Using our long experience as an ETF publication, we try to help select those ETFs that matter even if they might be repetitive. The result is a more manageable list of issues from which to choose.
We stick with the “blend” category since they should satisfy most investor needs. We believe these constitute the best index-based offerings individuals and financial advisors may utilize.
Uniquely, investors should remember, small cap issues usually carry higher beta (volatility or higher risk levels) than their large cap peers. This means during times of higher economic growth combined with accommodative Fed monetary policies, returns in this sector will outperform larger cap issues. But, the opposite situation does occur (should conditions reverse). Investors should remain aware of these risk characteristics.
One thing you’ll note is similarities in trends and performance in the charts posted below. This isn’t a coincidence given overall index constituents.
We feature a technical view of conditions from monthly chart views. Simplistically, we recommend longer-term investors stay on the right side of the 12 month simple moving average. When prices are above the moving average, stay long, and when below remain in cash or short. Some more interested in a fundamental approach may not care so much about technical issues preferring instead to buy when prices are perceived as low and sell for other reasons when high; but, this is not our approach.
For traders and investors wishing to hedge, leveraged and inverse issues are available to utilize from ProShares and Direxion and where available these are noted.![]()
JKJ follows the Morningstar Small Core Index which measures the performance of small cap stocks that have exhibited average growth and value characteristics. The fund was launched in June 2004. The expense ratio is 0.25%.
AUM equal $146 M and average daily trading volume is less than 6K shares. (Use “limit orders” here especially.) As of May 2012 the annual dividend yield was 0.77% and YTD return was 9.11%. The 1YR return was -4.31%.
Data as of May 2012
JKJ Top Ten Holdings And Weightings
· Superior Energy Services Inc (SPN): 1.14%
· Home Properties, Inc. (HME): 0.81%
· United Rentals Inc (URI): 0.80%
· Corrections Corporation of America (CXW): 0.79%
· Wesco International, Inc. (WCC): 0.78%
· Regal-Beloit Corporation (RBC): 0.77%
· Valmont Industries, Inc. (VMI): 0.77%
· SVB Financial Group (SIVB): 0.76%
· Carter's, Inc. (CRI): 0.75%
· Tanger Factory Outlet Centers (SKT): 0.74%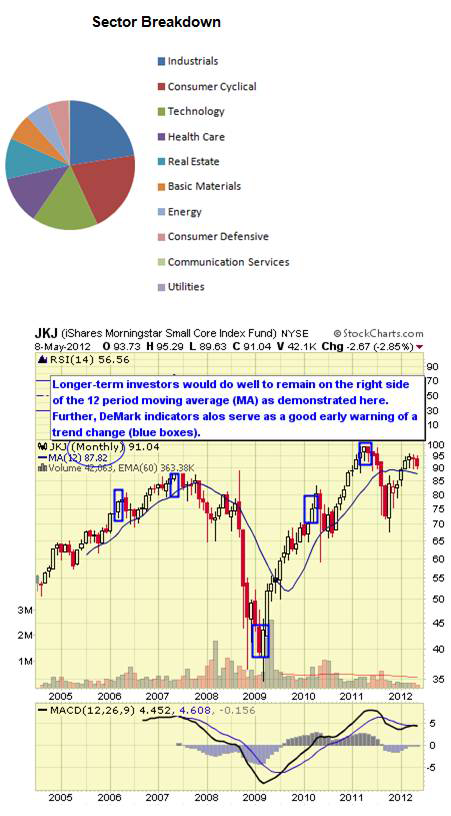
![]()
FYX follows the Defined Small Cap Core Index which is an "enhanced" index created and administered by Standard & Poor's which employs the AlphaDEX stock selection methodology to select stocks from the S&P SmallCap 600 Index. The fund was launched in May 2007.
The expense ratio is 0.70%. AUM equal $161M and average daily trading volume is 51K shares. As of May 2012 the annual dividend yield was 0.19% and YTD return 5.78%. The 1 YR return was -0.22%.
Data as of First Quarter 2012
FYX Top Ten Holdings And Weightings
· American Vanguard Corporation (AVD): 0.54%
· VOXX International Corp Class A (VOXX): 0.54%
· Almost Family, Inc. (AFAM): 0.52%
· Liz Claiborne, Inc. (LIZ): 0.52%
· Select Comfort Corporation (SCSS): 0.50%
· Sturm, Ruger & Company (RGR): 0.49%
· Zoll Medical Corporation (ZOLL): 0.49%
· Insight Enterprises, Inc. (NSIT): 0.48%
· Triquint Semiconductor (TQNT): 0.47%
· Multimedia Games Holding Co Inc (MGAM): 0.46%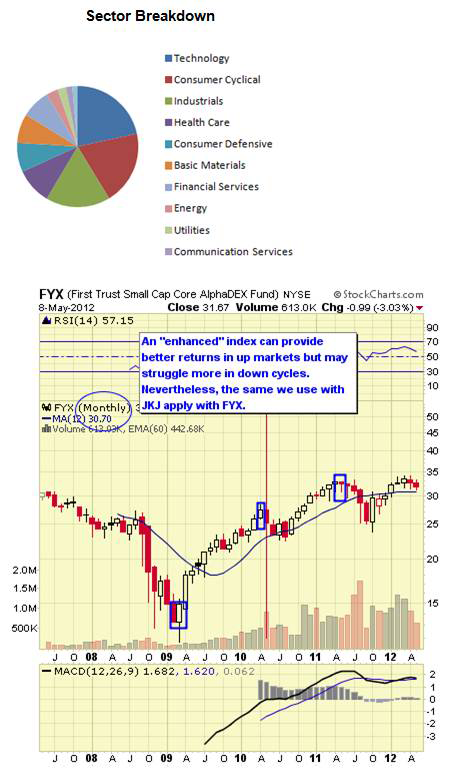
![]()
RWJ follows the Revenue Shares Small Cap Index which is comprised of the same securities as the S&P Small Cap 600 but weights the stocks according to top line revenue instead of market capitalization. The fund was launched in February 2008. The expense ratio is 0.54%.
AUM equal $125 M and average daily trading volume is 24K shares. As of May 2012 the annual dividend was 0.44% and YTD return was 6.03%. The 1 YR return was -0.45%.
Data as of May 2012
RWJ Top Ten Holdings And Weightings
· World Fuel Services Corporation (INT): 3.79%
· Synnex Corporation (SNX): 1.75%
· Sonic Automotive Inc (SAH): 1.53%
· Group I Automotive Inc (GPI): 1.27%
· EMCOR Group, Inc. (EME): 1.18%
· OfficeMax Inc (OMX): 1.18%
· Anixter International Inc (AXE): 1.06%
· Kelly Services, Inc. A (KELYA): 1.04%
· United Stationers Inc. (USTR): 1.01%
· Molina Healthcare, Inc. (MOH): 0.98%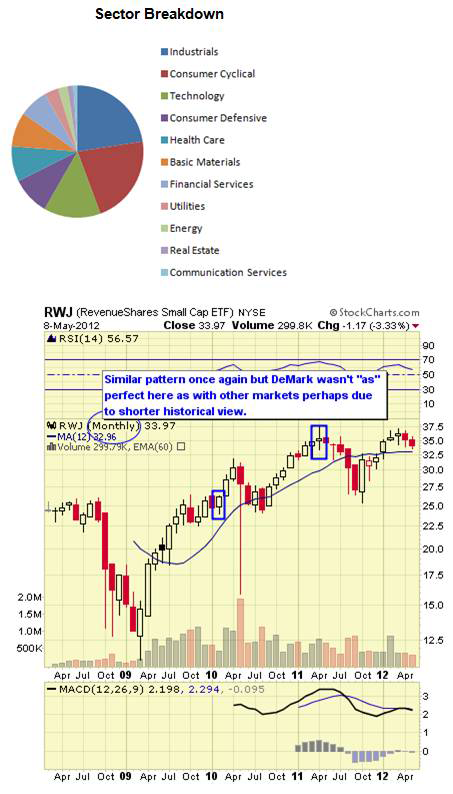
![]()
SLY follows the S&P Small Cap Index which measures the performance of the small capitalization sector of the U.S. equity market. The fund was launched in August 2005. The expense ratio is 0.20%. AUM equal $77M and average daily trading volume is less than 25K shares.
As of May 2012 the annual yield was 0.78% and YTD return 7.23%. The 1YR return was 1.46%.
Data as of May 2012
SLY Top Ten Holdings And Weightings
· Kilroy Realty Corporation (KRC): 0.65%
· Extra Space Storage, Inc. (EXR): 0.62%
· Salix Pharmaceuticals, Ltd. (SLXP): 0.59%
· Questcor Pharmaceuticals, Inc. (QCOR): 0.57%
· Tanger Factory Outlet Centers (SKT): 0.57%
· Mid-America Apartment Communities (MAA): 0.56%
· Proassurance Corporation (PRA): 0.54%
· Cubist Pharmaceuticals, Inc. (CBST): 0.53%
· Post Properties Inc (PPS): 0.52%
· Lufkin Industries, Inc. (LUFK): 0.51%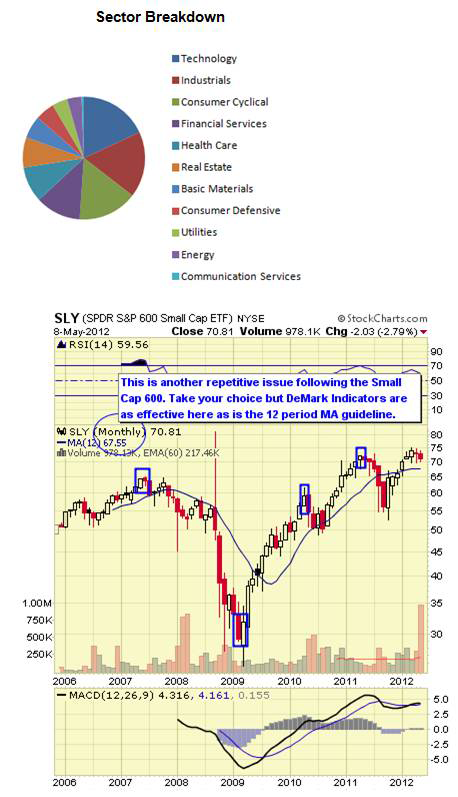
![]()
VTWO follows the Russell 2000 Index which measures the performance of the small-cap segment of the U.S. equity universe and is comprised of the smallest 2000 companies in the Russell 3000 Index, representing approximately 10% of the total market capitalization of that Index. It includes approximately 2000 of the smallest securities based on a combination of their market cap and current index membership.
The fund was launched in September 2010. The expense ratio is 0.15%. AUM equal $81M and average daily trading volume is 18K shares. As of May 2012 the annual dividend was 0.86% and YTD return 7.53%. The 1 YR return was -3.51%. VTWO trades commission free at Vanguard.
Data as of May 2012
VTWO Top Ten Holdings And Weightings
· CMT Market Liquidity Rate: 1.50%
· Healthspring, Inc. (HS): 0.33%
· NetLogic Microsystems, Inc. (NETL): 0.30%
· SuccessFactors, Inc. (SFSF): 0.30%
· Clean Harbors, Inc. (CLH): 0.26%
· World Fuel Services Corporation (INT): 0.26%
· Henry Jack & Associates, Inc. (JKHY): 0.26%
· American Campus Communities, Inc. (ACC): 0.25%
· Salix Pharmaceuticals, Ltd. (SLXP): 0.25%
· Onyx Pharmaceuticals, Inc. (ONXX): 0.25%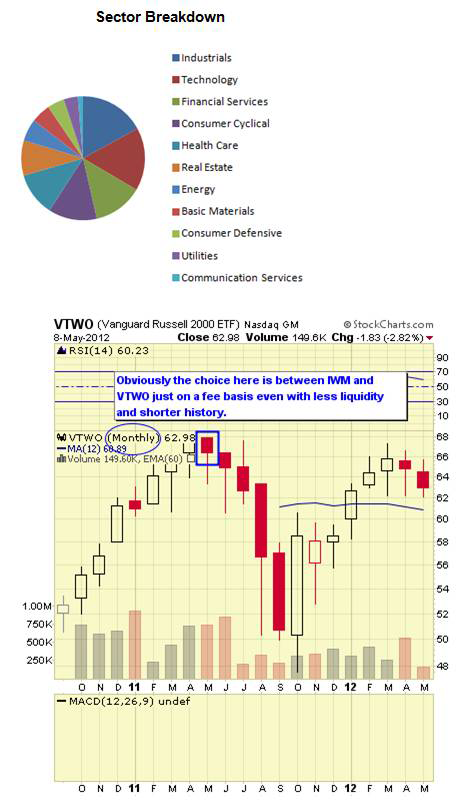
![]()
IWC follows the Russell Microcap Index which measures the performance of the microcap sector of the U.S. equity market. The fund was launched in August 2005. The expense ratio is 0.71%. AUM equal $443M and average daily trading volume is 120K shares.
As of May 2012 the annual dividend yield was 1.01% and YTD return was 9.72%. The 1 YR return was -4.14%. IWC trades commission free at TD Ameritrade.
Data as of First Quarter 2012
IWC Top Ten Holdings And Weightings
· Pharmacyclics, Inc. (PCYC): 0.52%
· ARMOUR Residential REIT Inc (ARR): 0.48%
· Sturm, Ruger & Company (RGR): 0.41%
· Liquidity Service, Inc. (LQDT): 0.41%
· Education Realty Trust, Inc. (EDR): 0.40%
· Peet's Coffee & Tea, Inc. (PEET): 0.39%
· Shuffle Master (SHFL): 0.38%
· Prestige Brands Holdings Inc (PBH): 0.33%
· LivePerson, Inc. (LPSN): 0.33%
· BBCN Bancorp Inc (BBCN): 0.33%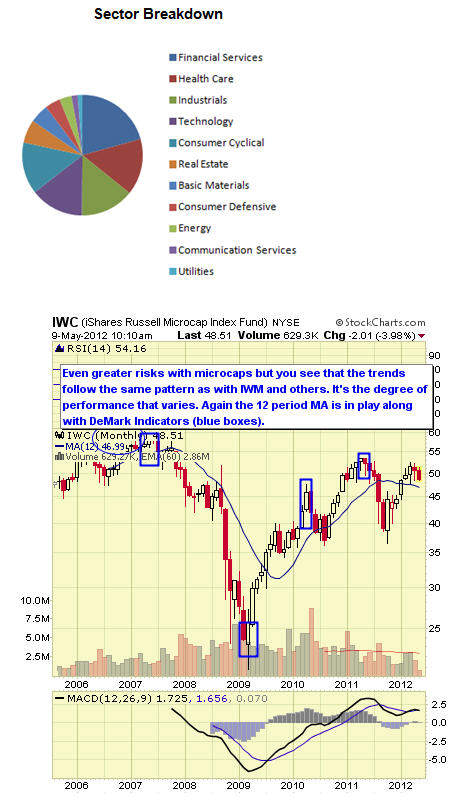
![]()
IWM tracks the Russell 2000 index which consists of the smallest 2000 stocks in the Russell 3000 index. The fund was launched in May 2000. The expense ratio is 0.28%.
AUM equal $14.244M and average daily trading volume 51M shares. As of May 2012 the annual dividend yield was 1.09% and YTD return 7.53%. The 1 YR return was -3.65. IWM trades commission free at Fidelity.
Data as of May 2012
IWM Top Ten Holdings And Weightings
· American Campus Communities, Inc. (ACC): 0.27%
· Kilroy Realty Corporation (KRC): 0.27%
· Clean Harbors, Inc. (CLH): 0.27%
· World Fuel Services Corporation (INT): 0.26%
· BioMed Realty Trust Inc (BMR): 0.25%
· Signature Bank (SBNY): 0.25%
· Home Properties, Inc. (HME): 0.24%
· Henry Jack & Associates, Inc. (JKHY): 0.24%
· Nu Skin Enterprises, Inc. Class A (NUS): 0.24%
· United Rentals Inc (URI): 0.24%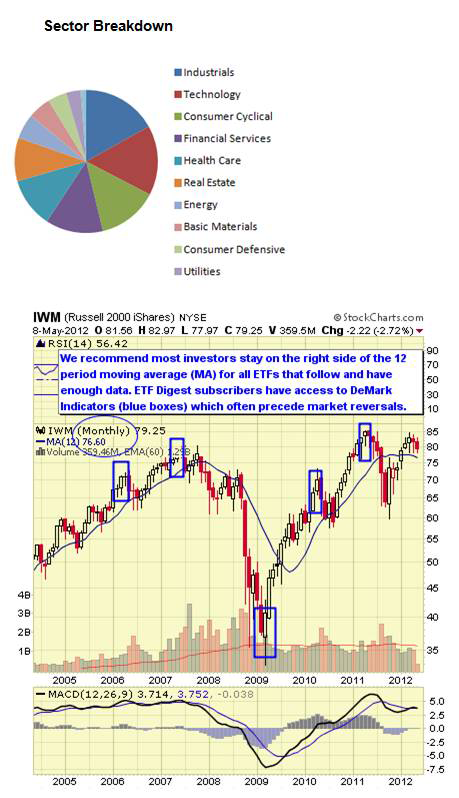
![]()
IJR follows the S&P SmallCap 600 Index. The fund was launched in May 2000. The expense ratio is 0.20%. AUM equal nearly $7.462M and average daily trading volume is around 1.4M shares. As of May 2012 the annual dividend yield was 0.77% and YTD return was 7.66%. The 1 YR return was 0.36%.
Through the third quarter of 2011 the fund was down -9.06%. IJY trades commission free at Fidelity and TD Ameritrade.
Data as of May 2012
IJR Top Ten Holdings And Weightings
· Kilroy Realty Corporation (KRC): 0.65%
· Extra Space Storage, Inc. (EXR): 0.62%
· Salix Pharmaceuticals, Ltd. (SLXP): 0.59%
· Questcor Pharmaceuticals, Inc. (QCOR): 0.57%
· Tanger Factory Outlet Centers (SKT): 0.57%
· Mid-America Apartment Communities (MAA): 0.56%
· Proassurance Corporation (PRA): 0.54%
· Cubist Pharmaceuticals, Inc. (CBST): 0.54%
· Post Properties Inc (PPS): 0.52%
· Lufkin Industries, Inc. (LUFK): 0.51%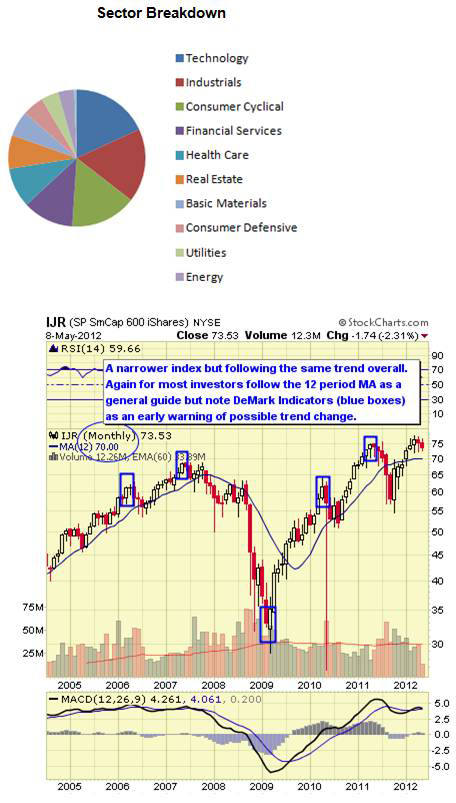
![]()
VB follows the MSCI US Small Cap 1750 Index which consists of 1750 small cap stocks in U.S. markets. The fund was launched in January 2004. The expense ratio is 0.16%. AUM equal $4,213 M and average daily trading volume exceeds 330K shares. As of May 2012 the annual dividend yield was 1.24% and YTD return 9.06%. The 1YR return was -2.10%.
As of the third quarter end in 2011 the YTD return was -8.89% demonstrating high volatility. VB trades commission free at TD Ameritrade and Vanguard.
Data as of May 2012
VB Top Ten Holdings And Weightings
· Panera Bread Company, Inc. A (PNRA): 0.27%
· Corn Products International, Inc. (CPO): 0.27%
· Oil States International, Inc. (OIS): 0.26%
· ITC Holdings Corp (ITC): 0.26%
· Biomarin Pharmaceutical, Inc. (BMRN): 0.26%
· Signet Jewelers Ltd. (SIG): 0.25%
· BRE Properties, Inc. (BRE): 0.25%
· Arthur J. Gallagher & Co. (AJG): 0.25%
· Foot Locker Inc (FL): 0.24%
· Senior Housing Properties Trust (SNH): 0.24%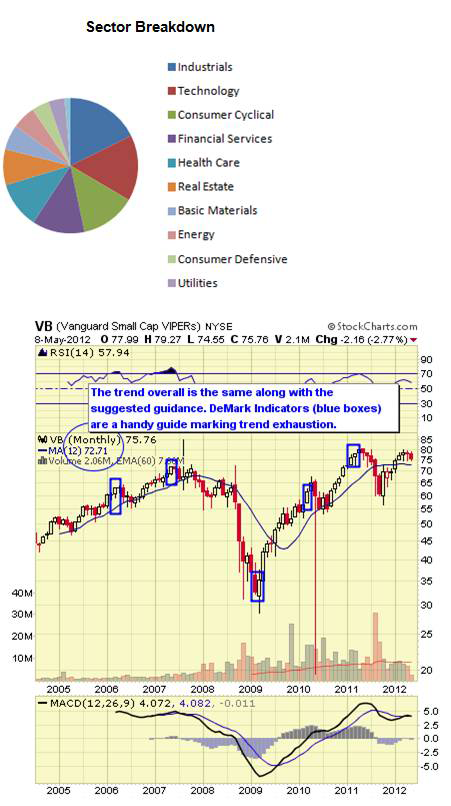
![]()
SCHA follows the Dow Jones U.S. Small Cap Total Stock Market Total Return Index which (aside from a mouthful) is a subset of the Dow Jones U.S. Total Stock Market Index, which measures all U.S. equity securities with readily available prices. The index represents the stocks ranked 751-2,500 by full market capitalization and is float-adjusted market cap weighted. The fund was launched in November 2009. The expense ratio is 0.13%.
AUM equal $635M and average daily trading volume is 156K shares. As of May 2012 the annual dividend yield was 0.88% and YTD return was 8.62%. The 1YR return was -2.62%. SCHA trades commission-free at Charles Schwab.
Data as of May 2012
SCHA Top Ten Holdings And Weightings
· Micros Systems, Inc. (MCRS): 0.28%
· Taubman Centers, Inc. (TCO): 0.28%
· Arthur J. Gallagher & Co. (AJG): 0.26%
· Cooper Companies (COO): 0.26%
· Wabco Holdings Incorporated (WBC): 0.26%
· Biomarin Pharmaceutical, Inc. (BMRN): 0.24%
· Gartner, Inc. Class A (IT): 0.24%
· Thomas & Betts Corporation (TNB): 0.24%
· Catalyst Health Solutions, Inc. (CHSI): 0.23%
· Ariba, Inc. (ARBA): 0.23%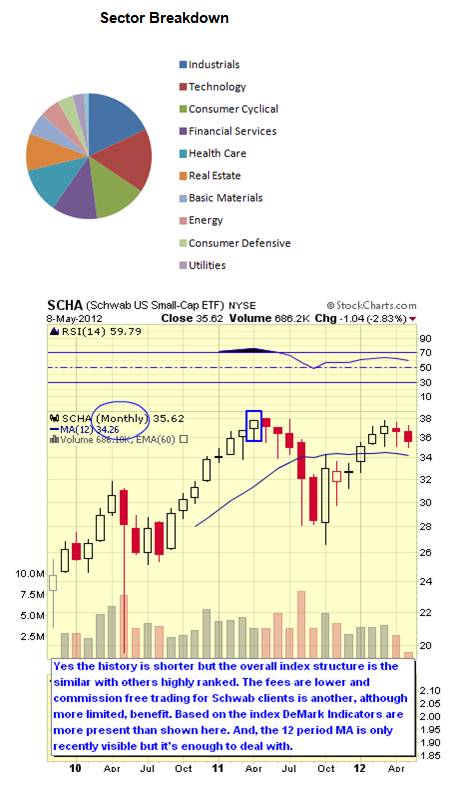
Ratings Explained: We rank the top 10 ETF by our proprietary stars system as outlined below. However, given that we’re sorting these by both short and intermediate issues we have split the rankings as we move from one classification to another.
Strong established linked index
Excellent consistent performance and index tracking
Low fee structure
Strong portfolio suitability
Excellent liquidity![]()
Established linked index even if “enhanced”
Good performance or more volatile if “enhanced” index
Average to higher fee structure
Good portfolio suitability or more active management if “enhanced” index
Decent liquidity![]()
Index is new
Issue is new and needs seasoning
Fees are high
Portfolio suitability also needs seasoning
Liquidity below average
As noted in the introduction and within many charts the Small Cap sector has the highest beta of the larger indexes. This means more volatility overall and better returns theoretically as overall stock markets rise. On the other hand, it can also mean underperformance as markets fall. This is why we believe it’s important to incorporate long-term technical indicators like DeMark to prevent large drawdowns like we’ve seen over the last decade especially.
It’s also important to remember that ETF sponsors have their own competitive business interests when issuing products which may not necessarily align with your investment needs. New ETFs from highly regarded and substantial new providers are also being issued. These may include Scottrade’s Focus Shares as other brokerage firms try issuing new ETFs with low expense ratios and commission free trading at their respective firms. These may also become popular as they become seasoned.
Disclosure: No current positions in the featured ETFs
Source for data is from ETF sponsors and various ETF data providers
- English (UK)
- English (India)
- English (Canada)
- English (Australia)
- English (South Africa)
- English (Philippines)
- English (Nigeria)
- Deutsch
- Español (España)
- Español (México)
- Français
- Italiano
- Nederlands
- Português (Portugal)
- Polski
- Português (Brasil)
- Русский
- Türkçe
- العربية
- Ελληνικά
- Svenska
- Suomi
- עברית
- 日本語
- 한국어
- 简体中文
- 繁體中文
- Bahasa Indonesia
- Bahasa Melayu
- ไทย
- Tiếng Việt
- हिंदी
Top 10 U.S. Small Cap ETFs
Latest comments
Loading next article…
Install Our App
Risk Disclosure: Trading in financial instruments and/or cryptocurrencies involves high risks including the risk of losing some, or all, of your investment amount, and may not be suitable for all investors. Prices of cryptocurrencies are extremely volatile and may be affected by external factors such as financial, regulatory or political events. Trading on margin increases the financial risks.
Before deciding to trade in financial instrument or cryptocurrencies you should be fully informed of the risks and costs associated with trading the financial markets, carefully consider your investment objectives, level of experience, and risk appetite, and seek professional advice where needed.
Fusion Media would like to remind you that the data contained in this website is not necessarily real-time nor accurate. The data and prices on the website are not necessarily provided by any market or exchange, but may be provided by market makers, and so prices may not be accurate and may differ from the actual price at any given market, meaning prices are indicative and not appropriate for trading purposes. Fusion Media and any provider of the data contained in this website will not accept liability for any loss or damage as a result of your trading, or your reliance on the information contained within this website.
It is prohibited to use, store, reproduce, display, modify, transmit or distribute the data contained in this website without the explicit prior written permission of Fusion Media and/or the data provider. All intellectual property rights are reserved by the providers and/or the exchange providing the data contained in this website.
Fusion Media may be compensated by the advertisers that appear on the website, based on your interaction with the advertisements or advertisers.
© 2007-2025 - Fusion Media Limited. All Rights Reserved.
