For some investors a “one size fits all” approach can be more compelling. After all, it’s easier to deal with just one ETF in a sector than trying to deal with many different subsectors. Lastly, some investors feel they just don’t have the resources to chop their allocation into many different ETFs devoted to bonds.
Therefore we examine a comprehensive list of aggregate bond ETFs to satisfy these investors. This seems more manageable for most investors. Let’s remember, in the fixed-income sector there are many choices but with many being repetitive it’s not necessary to cover them all. In fact most of the choices we list in this review are repetitive although most sponsors would no doubt disagree.
Our goal is to cover the most important ETFs within this category using high assets under management, liquidity and / or strategies that make a difference. Newer issues tied to new indices with long (over 5 years) of historical data may be worth investigating, featuring and using if warranted after they become more seasoned. Total Bond ETFs have the characteristic of incorporating many different maturities and issues into one all-inclusive issue.
From a total return view, 2011 was a great year for bond investments generally. 2012 is shaping up as a more challenging environment as further appreciation beyond low yields seems less likely. In 2011, investors fled stock markets and central bankers around the globe were lowering interest rates on fear of stagnant economic growth. Investors sought refuge in bonds and under the mattress.
Ultimately accommodative central bank policies, if continued too long, historically will lead to inflation. Central planners can’t have it both ways—fighting deflation and preventing inflation. (The U.S. Fed as of this publication is now 40 months into near zero interest rate policies.) This is why many bond investors have matched their fixed income holdings with gold. Finally we all know the reality the previous year’s winners often become the next year’s losers. With yields this low on many bond ETFs they’re hard to justify given both the twin risks of low to negative yields and longer duration.
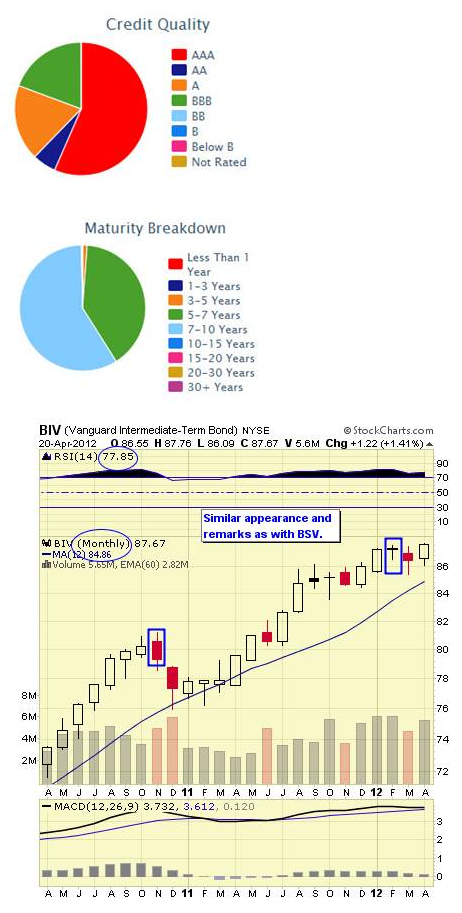
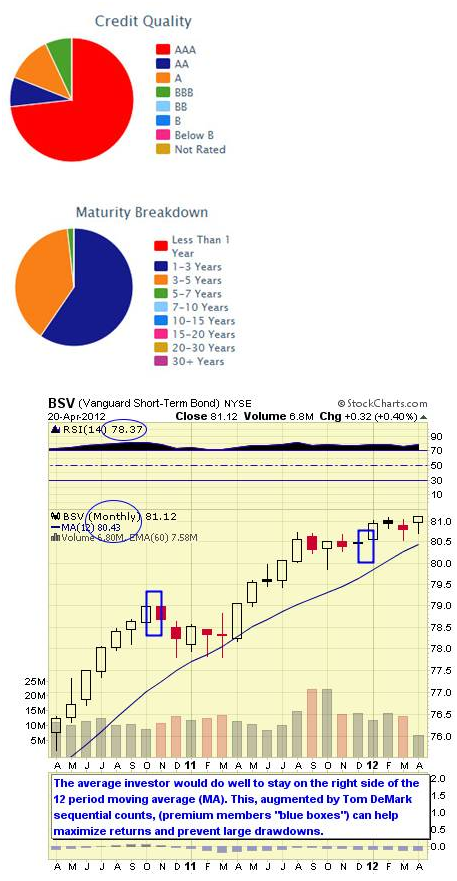
We feature a technical view of conditions from monthly chart views. Simplistically, we recommend longer-term investors stay on the right side of the 12 month simple moving average. When prices are above the moving average, stay long, and when below remain in cash or short. Some more interested in a fundamental approach may not care so much about technical issues preferring instead to buy when prices are perceived as low and sell for other reasons when high; but, this is not our approach.
Members to the ETF Digest receive added signals when markets become extended such as DeMark triggers to exit overbought / oversold conditions.
For traders and investors wishing to hedge, leveraged and inverse issues are available to utilize from ProShares and Direxion and where available these are noted.
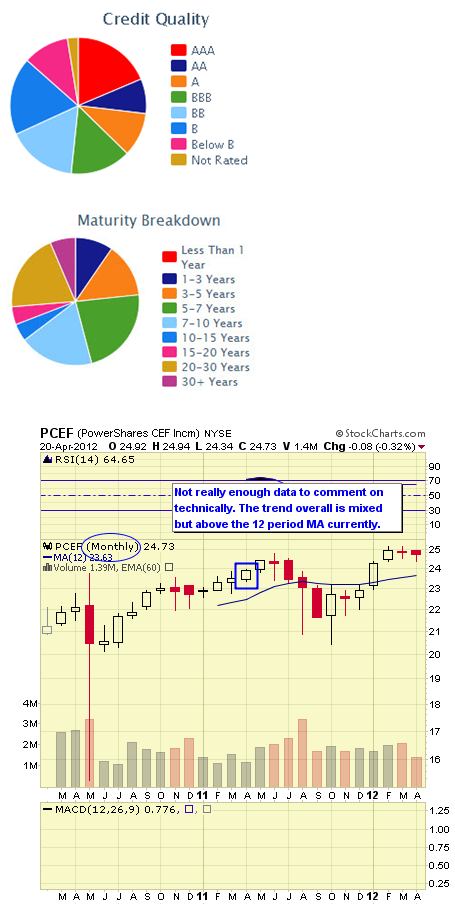
10: PowerShares CEF Income Composite ETF (PCEF) **
PCEF follows the S-Network Composite Closed-End Fund Index which is a rules-based index intended to give investors a means of tracking the overall performance of a global universe of U.S.-listed closed-end funds. CEFX is reconstructed on a quarterly basis from a universe of approximately 350 closed-end funds.
The fund was launched in February 2010. The expense ratio is 0.50%. (Remember, holding closed-end funds means you’re paying fees on them in addition to PCEF.) AUM equal $278 M and average daily trading volume is 93K shares. As of April 2012 the annual dividend yield was 8.25% and YTD return was 7.61%. The one year return was 4.09%.
Data as of April 2012
PCEF Top Ten Holdings and Weightings
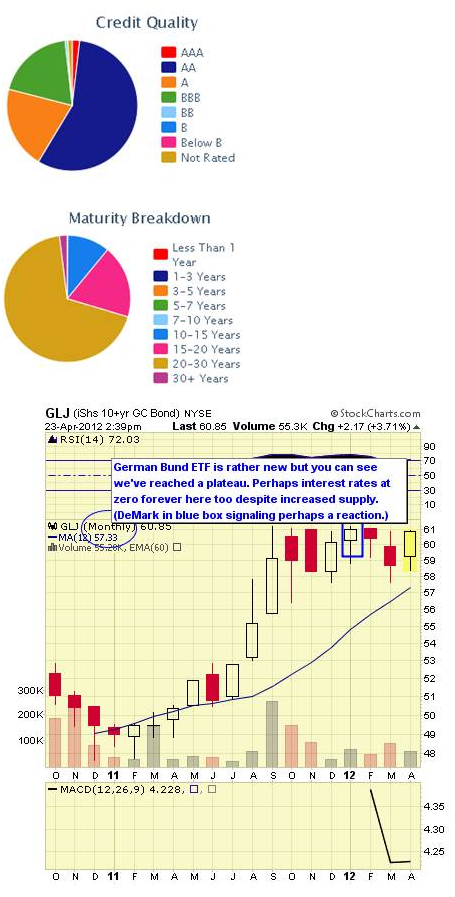
9: iShares 10+ Year Government/Credit Bond ETF (GLJ) ***
GLJ follows the BofA Merrill Lynch 10+ year U.S. Corporate & Government Index which includes publicly issued U.S. Treasury debt, U.S. government agency debt, taxable debt issued by U.S. states and territories and their political subdivisions, debt issued by U.S. and non-U.S. corporations, non-U.S. government debt and supranational debt.
The fund was launched in December 2009. The expense ratio is .20%. AUM equal $24 million and average daily trading volume is 3.6K shares. As of April 2012 the annual yield is 3.09% and YTD return was -0.49%. The one year return was 19.20%.
Data as of April 2012
GLJ Top Ten Holdings and Weightings
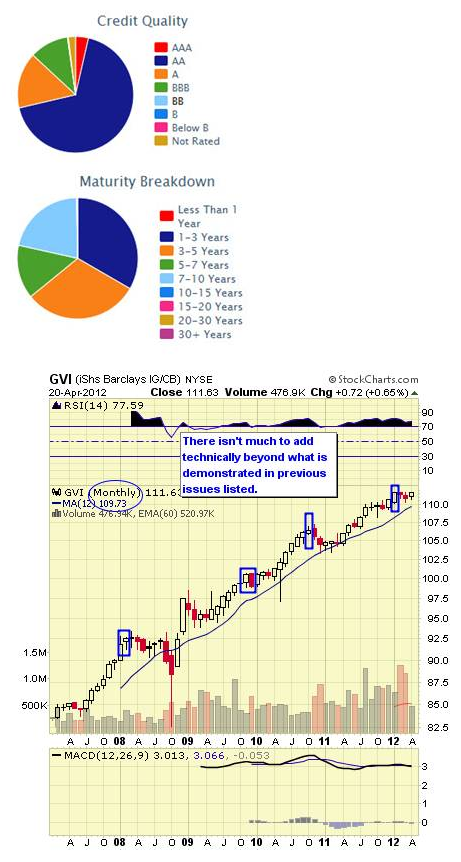
8: iShares Barclays Intermediate Bond ETF (GVI) ***
GVI follows the Barclays Capital U.S. Intermediate Government/Credit Bond Index which measures the performance of U.S. Dollar denominated U.S. Treasuries, government-related and investment grade U.S. corporate securities that have a remaining maturity of greater than one year and less than ten years.
The fund was launched in January 2007. The expense ratio is .20%. AUM equal$768M and average daily trading volume is 48K shares. As of April 2012 the annual dividend yield was 1.93% and YTD return was 0.22%. The one year return was 5.25%.
Data as of April 2012
GVI Top Ten Holdings and Weightings
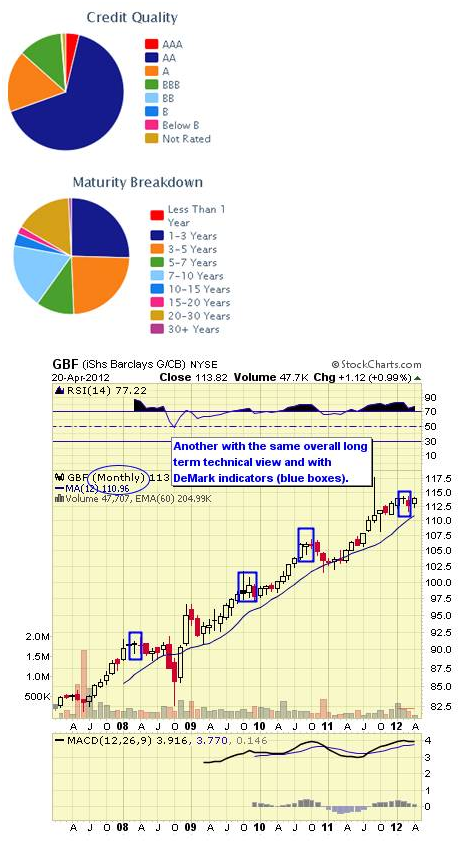
7: iShares Barclays Government/Credit Bond ETF (GBF) ****
GBF follows the Barclays Capital U.S. Government/Credit Bond Index. This ETF follows a wide range of bond issues with maturities greater than 1 year with roughly 47% below 5 years and balance evenly spread beyond. Over 65% of the assets are AAA rated with the balance investment grade except for 1.25% non-rated.
The fund was launched in January 2007. The expense ratio is .20%. AUM equal $136M and average daily trading volume is 8K shares. As of April 2012 the annual dividend yield was 2.29% and YTD return 0.05%. The one year return was 8.20%.
Data as of April 2012
GBF Top Ten Holdings and Weightings
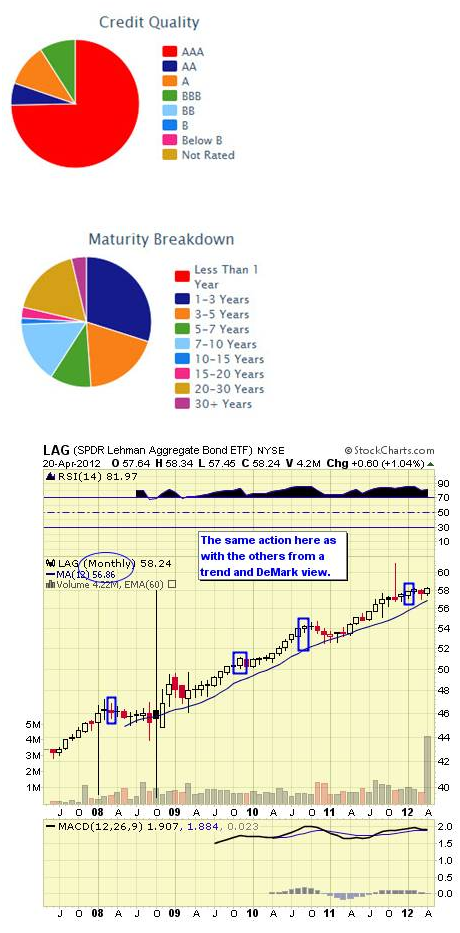
6: SPDR Barclays Aggregate Bond ETF (LAG) ****
LAG also follows the Barclays Capital U.S. Aggregate Bond Index which measures the performance of the U.S. investment grade bond market. The fund was launched in May 2007. The expense ratio is .17%. AUM equal $534M and average daily trading volume is 95K shares. As of April 2012 the annual dividend yield was 2.79% and YTD return was 0.64%. The one year return was 7.35%.
Data as of April 2012
LAG Top Ten Holdings and Weightings
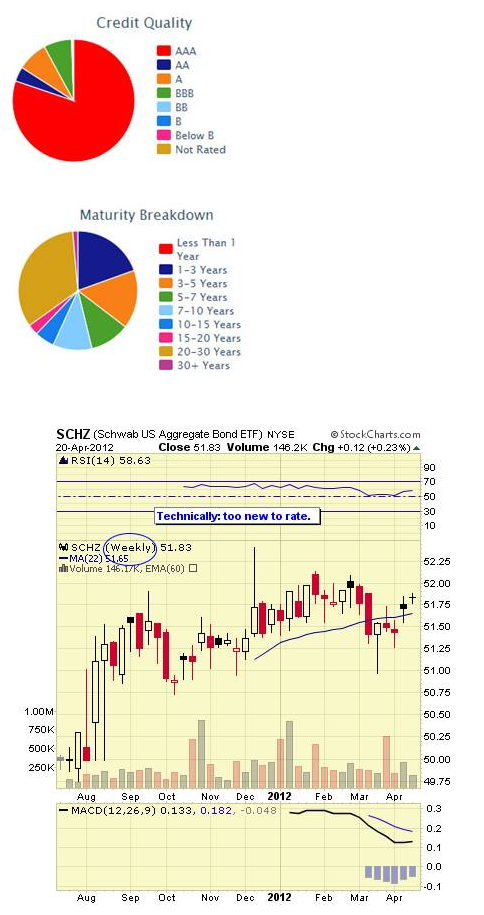
5: Schwab U.S. Aggregate Bond ETF (SCHZ) ****
SCHZ follows the Barclays Capital U.S. Aggregate Bond Index which measures the performance of the U.S. investment grade bond market. The fund was launched on July 2011. The expense ratio is .10%. AUM equal $228M and average daily trading volume 58.2K shares.
SCHZ trades commission free for Schwab customers. As of April 2012, the annual dividend yield was 0.75% and YTD return was 0.29%.
Data as of April 2012
SCHZ Top Ten Holdings and Weightings
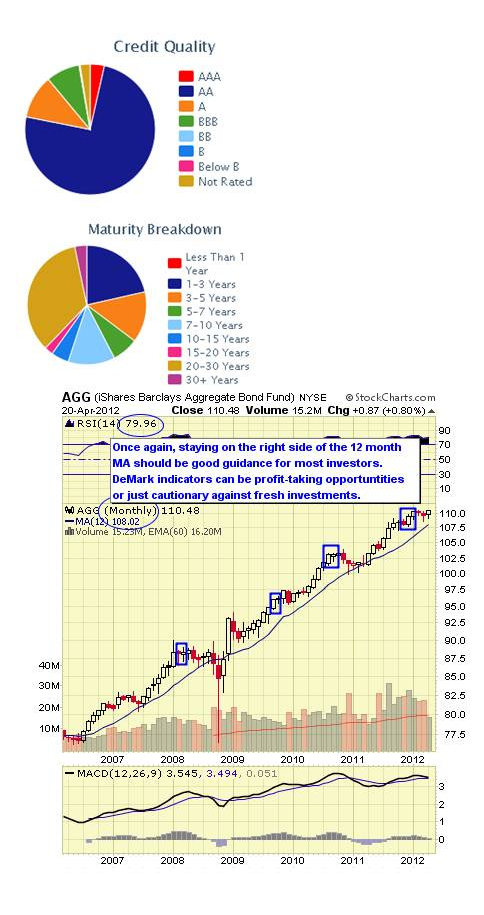
4: iShares Barclays Aggregate Bond Fund ETF (AGG) ****
AGG follows the Barclays Capital U.S. Aggregate Bond Index which consists of a mix of U.S. Government, mortgage-backed, investment grade corporate and even some municipal bond securities. The credit quality is all above BBB with 75% being AAA, while the maturity range is roughly 60% below 10 years with the balance 20 years or longer.
The fund was on launched September 2003. The expense ratio is .22%. AUM equal $14M and average daily trading volume is over 1M shares. AGG trades commission free at Fideliy and TD Ameritrade. As of April 2012 the annual dividend yield was 2.34% and YTD return was .19%. The one year return was 7.03%.
Data as of April 2012
AGG Top Ten Holdings and Weightings
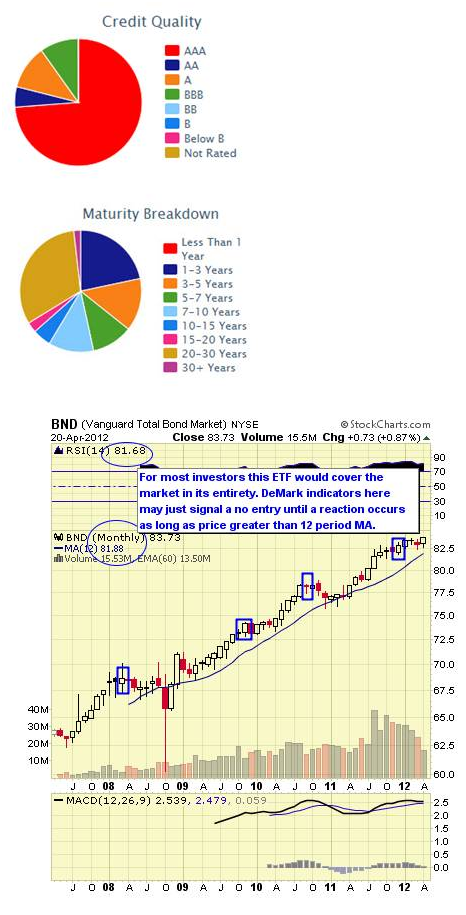
3: Vanguard Total Bond Market ETF (BND) ****
BND follows the Barclays U.S. Aggregate Bond Index. The fund was launched in April 2007. The expense ratio is .11% or nearly half that of AGG. Given the index, you’ll not find much variation in holdings, durations or credit quality. AUM equal $15M and average daily trading volume is 1.2M shares.
BND trades commission free at TD Ameritrad and Vanguard. As of April 2012 the annual dividend yield was 2.54% and YTD return .71%. The one year return was 6.89%.
Data as April 2012
BND Top Ten Holdings and Weightings
2: Vanguard Intermediate Term Bond ETF (BIV) ****
BIV follows the Barclays Capital U.S. 5-10 Year Government/Credit Bond Index which includes all medium and larger issues of U.S. government, investment-grade corporate, and investment-grade international dollar-denominated bonds that have maturities between 5 and 10 years and are publicly issued. The fund was launched in April 2007. The expense ratio is .14%.
AUM equal $3.1M and average daily trading volume is 298K shares. BIV trades commission free at Firstrade, TD Ameritrade and Vanguard. As of April 2012 the annual dividend yield was 2.97% and YTD return was 1.42%. The one year return was 9.56%.
Data as of April 2012
BIV Top Ten Holdings and Weightings
1: Vanguard Short-Term Bond ETF (BSV) ****
BSV follows the Barclays Capital U.S. 1-5 Year Government/Credit Bond Index which includes all medium and larger issues of U.S. government, investment-grade corporate, and investment-grade international dollar-denominated bonds that have maturities of between 1 and 5 years and are publicly issued. The fund was launched in April 2007. The expense ratio is .14%.
AUM equal $7.5M and average daily trading volume is 592K shares. BSV trades commission free at Firstrade, TD Ameritrade and Vanguard. As of April 2012 the annual dividend yield was 1.52% and YTD return was .56%. The one year return was 2.33%.
Data as of April 2012
BSV Top Ten Holdings and Weightings
Rankings Explained: We rank the top 10 ETF by our proprietary stars system as outlined below. However, given that we’re sorting these by both short and intermediate issues we have split the rankings as we move from one classification to another.
****
With the bonds listed above there are enough to choose from to satisfy any investor need. Again, 37 months of zero interest policies from the U.S. Fed have kept interest rates and yields low. Fear from stock market volatility and investor demographics have stimulated buying of bond ETFs overall.
It’s also important to remember that ETF sponsors have their own competitive business interests when issuing products which may not necessarily align with your investment needs. New ETFs from highly regarded and substantial new providers are also being issued. These may include Charles Schwab’s ETFs and Scottrade’s Focus Shares which both are issuing new ETFs with low expense ratios and commission free trading at their respective firms. These may also become popular as they become seasoned.
Disclosure: The ETF Digest is long BND
(Source for data is from ETF sponsors and various ETF data providers)
Therefore we examine a comprehensive list of aggregate bond ETFs to satisfy these investors. This seems more manageable for most investors. Let’s remember, in the fixed-income sector there are many choices but with many being repetitive it’s not necessary to cover them all. In fact most of the choices we list in this review are repetitive although most sponsors would no doubt disagree.
Our goal is to cover the most important ETFs within this category using high assets under management, liquidity and / or strategies that make a difference. Newer issues tied to new indices with long (over 5 years) of historical data may be worth investigating, featuring and using if warranted after they become more seasoned. Total Bond ETFs have the characteristic of incorporating many different maturities and issues into one all-inclusive issue.
From a total return view, 2011 was a great year for bond investments generally. 2012 is shaping up as a more challenging environment as further appreciation beyond low yields seems less likely. In 2011, investors fled stock markets and central bankers around the globe were lowering interest rates on fear of stagnant economic growth. Investors sought refuge in bonds and under the mattress.
Ultimately accommodative central bank policies, if continued too long, historically will lead to inflation. Central planners can’t have it both ways—fighting deflation and preventing inflation. (The U.S. Fed as of this publication is now 40 months into near zero interest rate policies.) This is why many bond investors have matched their fixed income holdings with gold. Finally we all know the reality the previous year’s winners often become the next year’s losers. With yields this low on many bond ETFs they’re hard to justify given both the twin risks of low to negative yields and longer duration.
We feature a technical view of conditions from monthly chart views. Simplistically, we recommend longer-term investors stay on the right side of the 12 month simple moving average. When prices are above the moving average, stay long, and when below remain in cash or short. Some more interested in a fundamental approach may not care so much about technical issues preferring instead to buy when prices are perceived as low and sell for other reasons when high; but, this is not our approach.
Members to the ETF Digest receive added signals when markets become extended such as DeMark triggers to exit overbought / oversold conditions.
For traders and investors wishing to hedge, leveraged and inverse issues are available to utilize from ProShares and Direxion and where available these are noted.
10: PowerShares CEF Income Composite ETF (PCEF) **
PCEF follows the S-Network Composite Closed-End Fund Index which is a rules-based index intended to give investors a means of tracking the overall performance of a global universe of U.S.-listed closed-end funds. CEFX is reconstructed on a quarterly basis from a universe of approximately 350 closed-end funds.
The fund was launched in February 2010. The expense ratio is 0.50%. (Remember, holding closed-end funds means you’re paying fees on them in addition to PCEF.) AUM equal $278 M and average daily trading volume is 93K shares. As of April 2012 the annual dividend yield was 8.25% and YTD return was 7.61%. The one year return was 4.09%.
Data as of April 2012
PCEF Top Ten Holdings and Weightings
- Eaton Vance Tax-Mgd Glb Divrs Equity Inc: 5.79%
- Alliance Bernstein Income Fund: 3.82%
- Eaton Vance Tax-Managed Divrs Equity Inc: 3.07%
- Eaton Vance Limited Duration Income: 2.92%
- Nuveen Multi-Strategy Income & Growth 2: 2.53%
- Eaton Vance Tx-Mgd Glbl Buy-Write Opp: 2.47%
- Aberdeen Asia-Pacific Income Fund: 2.43%
- NFJ Dividend, Interest & Premium Strat: 2.09%
- Blackrock Build America Bond Trust: 2.05%
- Nuveen Quality Preferred Income 2: 1.75%

9: iShares 10+ Year Government/Credit Bond ETF (GLJ) ***
GLJ follows the BofA Merrill Lynch 10+ year U.S. Corporate & Government Index which includes publicly issued U.S. Treasury debt, U.S. government agency debt, taxable debt issued by U.S. states and territories and their political subdivisions, debt issued by U.S. and non-U.S. corporations, non-U.S. government debt and supranational debt.
The fund was launched in December 2009. The expense ratio is .20%. AUM equal $24 million and average daily trading volume is 3.6K shares. As of April 2012 the annual yield is 3.09% and YTD return was -0.49%. The one year return was 19.20%.
Data as of April 2012
GLJ Top Ten Holdings and Weightings
- US Treasury Bond 4.75%: 4.80%
- US Treasury Bond 3.875%: 3.74%
- US Treasury Bond 4.375%: 2.93%
- US Treasury Bond 3.5%: 2.62%
- US Treasury Bond 4.25%: 2.62%
- US Treasury Bond 4.375%: 2.32%
- US Treasury Bond 4.25%: 2.22%
- US Treasury Bond 6.25%: 2.05%
- US Treasury Bond 4.75%: 2.02%
- US Treasury Bond 7.25%: 1.75%

8: iShares Barclays Intermediate Bond ETF (GVI) ***
GVI follows the Barclays Capital U.S. Intermediate Government/Credit Bond Index which measures the performance of U.S. Dollar denominated U.S. Treasuries, government-related and investment grade U.S. corporate securities that have a remaining maturity of greater than one year and less than ten years.
The fund was launched in January 2007. The expense ratio is .20%. AUM equal$768M and average daily trading volume is 48K shares. As of April 2012 the annual dividend yield was 1.93% and YTD return was 0.22%. The one year return was 5.25%.
Data as of April 2012
GVI Top Ten Holdings and Weightings
- US Treasury Note 4.75%: 8.15%
- US Treasury Note 4.875%: 6.97%
- US Treasury Note 3.375%: 3.81%
- US Treasury Note 0.625%: 2.84%
- FNMA 5%: 1.95%
- US Treasury Note 3.625%: 1.86%
- US Treasury Note 1.25%: 1.74%
- US Treasury Note 1.875%: 1.68%
- US Treasury Note 1.75%: 1.65%
- US Treasury Note 3.625%: 1.52%

7: iShares Barclays Government/Credit Bond ETF (GBF) ****
GBF follows the Barclays Capital U.S. Government/Credit Bond Index. This ETF follows a wide range of bond issues with maturities greater than 1 year with roughly 47% below 5 years and balance evenly spread beyond. Over 65% of the assets are AAA rated with the balance investment grade except for 1.25% non-rated.
The fund was launched in January 2007. The expense ratio is .20%. AUM equal $136M and average daily trading volume is 8K shares. As of April 2012 the annual dividend yield was 2.29% and YTD return 0.05%. The one year return was 8.20%.
Data as of April 2012
GBF Top Ten Holdings and Weightings
- Health Care Reit 4.125%: 6.91%
- US Treasury Note 4.625%: 5.41%
- US Treasury Note 3.625%: 5.02%
- US Treasury Note 4.75%: 4.63%
- US Treasury Bond 7.625%: 2.59%
- US Treasury Note 2%: 2.40%
- US Treasury Note 2.375%: 2.28%
- US Treasury Bond 4.5%: 2.19%
- US Treasury Note 2.125%: 2.05%
- US Treasury Note 1.25%: 1.98%

6: SPDR Barclays Aggregate Bond ETF (LAG) ****
LAG also follows the Barclays Capital U.S. Aggregate Bond Index which measures the performance of the U.S. investment grade bond market. The fund was launched in May 2007. The expense ratio is .17%. AUM equal $534M and average daily trading volume is 95K shares. As of April 2012 the annual dividend yield was 2.79% and YTD return was 0.64%. The one year return was 7.35%.
Data as of April 2012
LAG Top Ten Holdings and Weightings
- FHLMC: 3.12%
- FNMA: 2.75%
- FNMA: 2.01%
- FNMA: 1.68%
- GNMA: 1.59%
- FHLMC: 1.54%
- US Treasury Note 3.125%: 1.53%
- US Treasury Note 0.5%: 1.52%
- GNMA: 1.34%
- US Treasury Note 3.125%: 1.30%

5: Schwab U.S. Aggregate Bond ETF (SCHZ) ****
SCHZ follows the Barclays Capital U.S. Aggregate Bond Index which measures the performance of the U.S. investment grade bond market. The fund was launched on July 2011. The expense ratio is .10%. AUM equal $228M and average daily trading volume 58.2K shares.
SCHZ trades commission free for Schwab customers. As of April 2012, the annual dividend yield was 0.75% and YTD return was 0.29%.
Data as of April 2012
SCHZ Top Ten Holdings and Weightings
- US Treasury Note 1.75%: 1.69%
- US Treasury Note 1%: 1.62%
- US Treasury Bond 9.125%: 1.31%
- US Treasury Note 2.625%: 1.28%
- US Treasury Note 1.375%: 1.16%
- FNMA 1.625%: 1.10%
- Ssc Goverment Mm Gvxx: 1.08%
- US Treasury Note 0.25%: 1.08%
- US Treasury Note 3.375%: 1.06%
- US Treasury Note 1.75%: 1.02%

4: iShares Barclays Aggregate Bond Fund ETF (AGG) ****
AGG follows the Barclays Capital U.S. Aggregate Bond Index which consists of a mix of U.S. Government, mortgage-backed, investment grade corporate and even some municipal bond securities. The credit quality is all above BBB with 75% being AAA, while the maturity range is roughly 60% below 10 years with the balance 20 years or longer.
The fund was on launched September 2003. The expense ratio is .22%. AUM equal $14M and average daily trading volume is over 1M shares. AGG trades commission free at Fideliy and TD Ameritrade. As of April 2012 the annual dividend yield was 2.34% and YTD return was .19%. The one year return was 7.03%.
Data as of April 2012
AGG Top Ten Holdings and Weightings
- US Treasury Note 4.75%: 3.55%
- US Treasury Bond 7.5%: 2.59%
- US Treasury Note 3.625%: 2.33%
- US Treasury Note 3.125%: 1.98%
- US Treasury Bond 8.125%: 1.89%
- US Treasury Note 3.375%: 1.81%
- US Treasury Bond 7.625%: 1.51%
- US Treasury Bond 4.625%: 1.46%
- US Treasury Note 2.375%: 1.28%
- US Treasury Note 1.875%: 1.03%

3: Vanguard Total Bond Market ETF (BND) ****
BND follows the Barclays U.S. Aggregate Bond Index. The fund was launched in April 2007. The expense ratio is .11% or nearly half that of AGG. Given the index, you’ll not find much variation in holdings, durations or credit quality. AUM equal $15M and average daily trading volume is 1.2M shares.
BND trades commission free at TD Ameritrad and Vanguard. As of April 2012 the annual dividend yield was 2.54% and YTD return .71%. The one year return was 6.89%.
Data as April 2012
BND Top Ten Holdings and Weightings
- CMT Market Liquidity Rate: 4.11%
- US Treasury Note 0.625%: 1.25%
- US Treasury Bond 6.25%: 0.93%
- US Treasury Note 1.375%: 0.79%
- US Treasury Note 1.875%: 0.75%
- US Treasury Note 1%: 0.70%
- Gnma Ii 30yr Tba Jan: 0.63%
- US Treasury Note 1.875%: 0.63%
- US Treasury Bond 4.5%: 0.57%
- US Treasury Note 2.75%: 0.54%

2: Vanguard Intermediate Term Bond ETF (BIV) ****
BIV follows the Barclays Capital U.S. 5-10 Year Government/Credit Bond Index which includes all medium and larger issues of U.S. government, investment-grade corporate, and investment-grade international dollar-denominated bonds that have maturities between 5 and 10 years and are publicly issued. The fund was launched in April 2007. The expense ratio is .14%.
AUM equal $3.1M and average daily trading volume is 298K shares. BIV trades commission free at Firstrade, TD Ameritrade and Vanguard. As of April 2012 the annual dividend yield was 2.97% and YTD return was 1.42%. The one year return was 9.56%.
Data as of April 2012
BIV Top Ten Holdings and Weightings
- US Treasury Note 3.625%: 3.57%
- US Treasury Note 3.375%: 3.40%
- US Treasury Note 3.625%: 3.33%
- US Treasury Note 3.125%: 3.25%
- US Treasury Note 3.5%: 3.12%
- US Treasury Note 2%: 2.73%
- US Treasury Note 2.125%: 2.71%
- US Treasury Note 3.75%: 2.47%
- US Treasury Note 2.625%: 2.12%
- US Treasury Note 3.625%: 2.10%

1: Vanguard Short-Term Bond ETF (BSV) ****
BSV follows the Barclays Capital U.S. 1-5 Year Government/Credit Bond Index which includes all medium and larger issues of U.S. government, investment-grade corporate, and investment-grade international dollar-denominated bonds that have maturities of between 1 and 5 years and are publicly issued. The fund was launched in April 2007. The expense ratio is .14%.
AUM equal $7.5M and average daily trading volume is 592K shares. BSV trades commission free at Firstrade, TD Ameritrade and Vanguard. As of April 2012 the annual dividend yield was 1.52% and YTD return was .56%. The one year return was 2.33%.
Data as of April 2012
BSV Top Ten Holdings and Weightings
- US Treasury Note 0.375%: 2.00%
- US Treasury Note 2.5%: 1.79%
- US Treasury Note 2.625%: 1.78%
- US Treasury Note 0.875%: 1.71%
- US Treasury Note 1.75%: 1.65%
- US Treasury Note 0.625%: 1.59%
- US Treasury Note 2.375%: 1.59%
- US Treasury Note 0.875%: 1.56%
- US Treasury Note 0.25%: 1.40%
- US Treasury Note 1.875%: 1.22%

Rankings Explained: We rank the top 10 ETF by our proprietary stars system as outlined below. However, given that we’re sorting these by both short and intermediate issues we have split the rankings as we move from one classification to another.
****
- Strong established linked index
- Excellent consistent performance and index tracking
- Low fee structure
- Strong portfolio suitability
- Excellent liquidity
- Established linked index even if “enhanced”
- Good performance or more volatile if “enhanced” index
- Average to higher fee structure
- Good portfolio suitability or more active management if “enhanced” index
- Decent liquidity
- Enhanced or seasoned index
- Less consistent performance and more volatile
- Fees higher than average
- Portfolio suitability would need more active trading
- Average to below average liquidity
- Index is new
- Issue is new and needs seasoning
- Fees are high
- Portfolio suitability also needs seasoning
- Liquidity below average
With the bonds listed above there are enough to choose from to satisfy any investor need. Again, 37 months of zero interest policies from the U.S. Fed have kept interest rates and yields low. Fear from stock market volatility and investor demographics have stimulated buying of bond ETFs overall.
It’s also important to remember that ETF sponsors have their own competitive business interests when issuing products which may not necessarily align with your investment needs. New ETFs from highly regarded and substantial new providers are also being issued. These may include Charles Schwab’s ETFs and Scottrade’s Focus Shares which both are issuing new ETFs with low expense ratios and commission free trading at their respective firms. These may also become popular as they become seasoned.
Disclosure: The ETF Digest is long BND
(Source for data is from ETF sponsors and various ETF data providers)
