This listing includes the municipal bond ETFs that have proliferated over the past few years as issuers have discovered a reasonable way to price related indexes. After all, since bonds are a “dealer market” vs a listed securities market where valuations are transparent, pricing bonds has always been in the eye of the various bidders. A reasonable summary of this difficulty was published by Dan Seymour of the Bond Buyer in January 2011:
“The muni market includes more than 60,000 issuers and at least 1.2 million CUSIP numbers. Munis are considered less liquid than Treasury or corporate bonds. Some muni bonds never trade, and most trade infrequently. Indexes designed to reflect values in the municipal bond market rely on pricing services, such as Interactive Data, to evaluate bonds that aren’t trading.
Investors don’t necessarily always believe these pricing services: it might be that a bond that would otherwise be trading at a lower price is quoted by a pricing service at a higher price simply because nobody is trading it, so there’s no discovery of the lower price.
That explains why municipal yield-curve scales such as Municipal Market Data and Municipal Market Advisors can often disagree on where yield levels are — they are often extrapolating based on general conditions, rather than visible trades.”
Due to some late 2010 panic among investors, ETFs disconnected from their indexes as selling overwhelmed index structure creating large discounts to NAV for investors. This is why MUNI ETF returns were high during 2011 as the rebound occurred early in the year and no doubt exaggerated returns. And now yields are low but not necessarily lower than taxable yields for the same maturity. I remember complaining to my boss in 1976 when yields suddenly dropped to 5% briefly for high grade general obligation bonds. He calmly said: “They’ll buy ‘em even when they’re 3% because they hate taxes always.” He was right.
As a former bond dealer myself with a Municipal Principal Series 53 license, I can attest to these difficulties. You may think these problems are isolated and they can be but remember the difficulty encountered by muni-bond funds one year ago when most funds were not tracking the indexes well at all. This was occasioned by investor flight given worries over municipal budgetary and fiscal soundness issues. (These problems are well-outlined in the linked article above.) But these issues can be geographic in nature as well. In 1975 the U.S. northeast was plagued by the contagion from NY City’s financial crisis. Suddenly Massachusetts, Pennsylvania and other municipalities in the region had to pay large premiums given their proximity to New York. California had its problems with tax reform later and Washington Public Power went bankrupt. In 1929 nearly 70% of all municipal bonds with investment grades went bankrupt so don’t be too sanguine about conditions.
The latest rage in muni-land which has always had the reputation as a gimmicky market is Build America Bonds (BABS). Investors should know these bonds are federally taxable but exempt from state and local taxes for investors from that jurisdiction. Institutions such as casualty insurance companies have been feasting on these issues and this is expected to continue. It’s more difficult to rank bonds where credit quality and maturity differences make the effort comparing apples to oranges. Nevertheless, we make the attempt.
We feature a technical view of conditions from monthly chart views. Simplistically, we recommend longer-term investors stay on the right side of the 12 month simple moving average. When prices are above the moving average, stay long, and when below remain in cash or short. Some more interested in a fundamental approach may not care so much about technical issues preferring instead to buy when prices are perceived as low and sell for other reasons when high; but, this is not our approach.
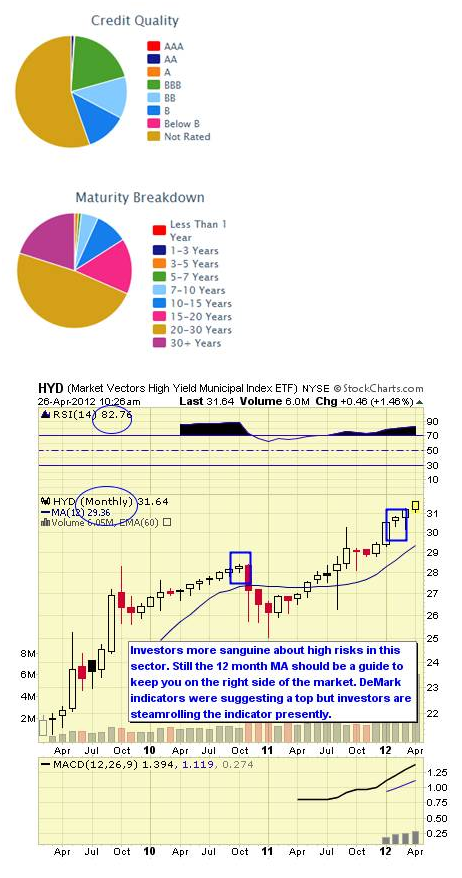
#10: Van Eck High Yield Municipal Bond ETF (HYD)****
HYD follows the Barclays Capital Municipal Custom High Yield Composite Index. HYD has a 25% weighting in investment grade (BBB) bonds and 75% in non-investment grade issues. The expense ratio is 0.35%. AUM equal $539M with average daily trading volume in excess of 262K shares.
As of April 2012 the annual dividend yield was 5.39% and YTD return 7.33%. The one year return was 17.50%.
Data as of April 2012
HYD Top Ten Holdings & Weightings
- Indiana Fin Auth 5.5%: 1.87%
- New Jersey Health Care Facs Fi Re 6.625%: 1.65%
- Montana St Brd Invt Res R Res 7%: 1.63%
- New Jersey Econ Dev Auth 6.625%: 1.55%
- Illinois Fin Auth 5.5%: 1.52%
- Illinois Fin Auth 8%: 1.48%
- West Virginia St Hosp Fin Auth 6.75%: 1.47%
- Delaware St Econ Dev Auth 5.375%: 1.46%
- Texas Private Activity Bd Surf Sr Lie 7%: 1.27%
- Illinois Fin Auth 8.125%: 1.24%
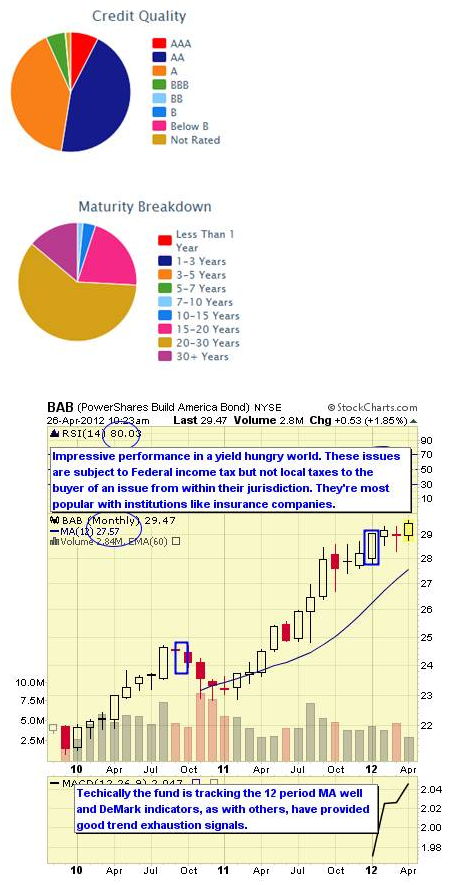
#9: Invesco PowerShares Build America Bonds ETF (BAB)****
BAB tracks the BofA Merrill Lynch Build America Bond Index which is part of stimulus program launched by the Obama administration. These bonds are hybrid securities and have the unique position of being taxable under the guidelines linked HERE.
BAB’s securities are 35% underwritten by the Federal government as to interest payments. These bonds have been extremely popular with institutional investors, particularly insurance companies. The fund was launched in 2009. The expense ratio is 0.35%. AUM equal $898M while average daily trading volume is 191K shares. As of April 2012 the annual dividend yield was 5.49% and YTD return 4.59%. The one return was 21.35%.
Data as of April 2012
BAB Top Ten Holdings
- Chicago Ill O Hare Intl Arpt R Ge 6.395%: 2.23%
- Los Angeles Calif Uni Sch Dist 6.758%: 1.82%
- California St Go Bds 6.509%: 1.79%
- Florida St Governmental Util A Ut 6.548%: 1.76%
- Chicago Ill O Hare Intl Arpt R Ge 6.845%: 1.67%
- California St Go Bds 7.55%: 1.55%
- Pennsylvania St Tpk Commn Tpk Rev 5.511%: 1.50%
- Chicago Ill Brd Ed Go Bds 6.138%: 1.47%
- New York N Y Go Bds 5.968%: 1.46%
- Orange Cnty Calif Santn Wastew Wast 6.4%: 1.39%
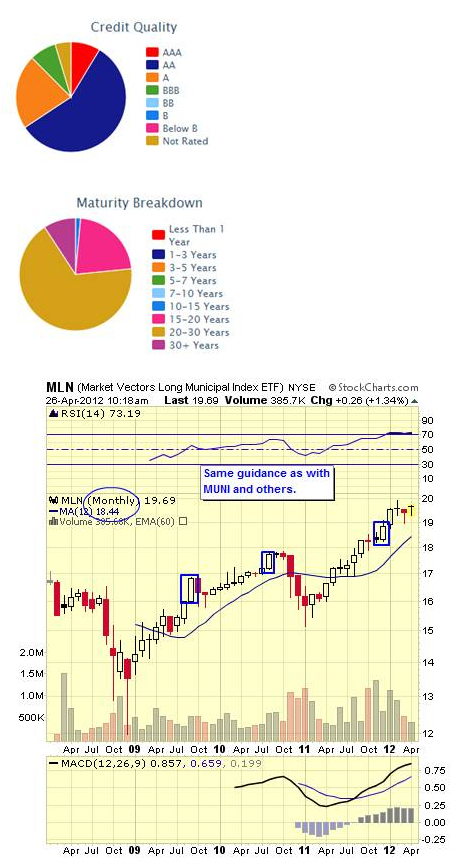
#8: Van Eck Market Vectors Long Municipal Bond ETF (MLN) ****
MLN follows the Barclays Capital AMT-Free Continuous Municipal Index which provides broad exposure to investment–grade municipal bonds with a nominal maturity of 17 years or more. The fund was launched in January 2008. The expense ratio is 0.24%. AUM equal $81.5M and average daily trading volume is 30.5K shares. As of April 2012 the annual dividend yield was 4.30% and YTD return 4.30%. The one year return was 19.41%.
Data as of April 2012
MLN Top Ten Holdings & Weightings
- Colorado Health Facs Auth 5%: 2.20%
- Massachusetts St Dev Fin Agy R Rev 5.25%: 2.10%
- Michigan Fin Auth 5%: 1.69%
- South Carolina St Pub Svcs Aut Rev Ob 5%: 1.67%
- Salt River Proj Ariz Agric Imp Rev Bd 5%: 1.59%
- Washington St Health Care Facs Rev Bd 5%: 1.47%
- Kentucky Econ Dev Fin Auth 5.375%: 1.45%
- Hawaii St Dept Budget & Fin Sp Rev 6.5%: 1.42%
- California St Go Bds 5%: 1.40%
- California Statewide Cmntys De Rev Re 5%: 1.37%
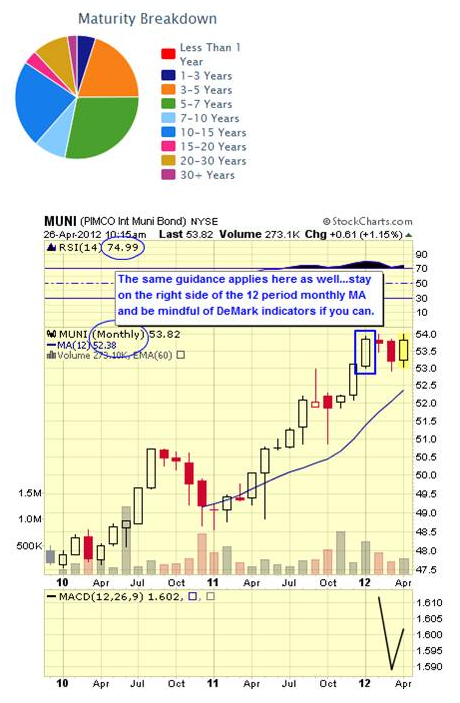
#7: PIMCO Intermediate Municipal Bond ETF (MUNI)****
MUNI is an actively managed designed to be appropriate for investors seeking tax-exempt income. The fund consists of a diversified portfolio of primarily intermediate duration of high quality bonds. The fund was launched in November 2009. The expense ratio is 0.35%. AUM equal $137.5M and average daily trading volume is 14.6K shares.
As of April 2012 the annual dividend is 1.65% and YTD return is 1.39%. The one year return is 7.92%.
Data as of April 2012
MUNI Top Ten Holdings Weightings
- Connecticut St Health & Edl Fa Rev Bd 5%: 4.07%
- Pennsylvania St Higher Edl Fac Rev 5.25%: 2.31%
- Barbers Hill Tex Indpt Sch Dis Ultd T 4%: 2.14%
- Texas Mun Gas Acquisition & Su Sr 5.625%: 2.12%
- Massachusetts St College Bldg Ref Rev 5%: 1.81%
- New York St Dorm Auth 5%: 1.80%
- New Jersey St Transn Tr Fd Aut Transp 5%: 1.80%
- New Jersey Econ Dev Auth 5%: 1.79%
- New York St Dorm Auth 5%: 1.76%
- Irvine Ranch Calif Wtr Dist: 1.68%
#6: SPDR Barclays Capital Municipal Bond ETF (TFI)****
TFI follows the Barclays Capital Municipal Managed Money Index is a rules-based, market-value weighted index engineered for the tax exempt bond market. All bonds in the National Municipal Bond Index must be rated Aa3/AA- or higher by at least two of the following statistical ratings agencies: Moody's, S&P and Fitch.
The fund was launched in September 2007. The expense ratio is 0.20%. AUM equal $1.5M and average daily trading volume is 312K shares. As of April 2012 the annual dividend yield was 2.72% and YTD return was 1.39%. The one year return was 11.99%. TFI trades commission free at TD Ameritrade.
Data as of April 2012
TFI Top Ten Holdings & Weightings
- Triborough Brdg & Tunl Auth 5%: 1.33%
- Triborough Brdg & Tunl Auth 5%: 1.31%
- Milwaukee Wis Go Prom N 5%: 1.26%
- Washington St Var Purp 4%: 1.17%
- California St Dept Wtr Res Pwr Pwr Su 5%: 1.15%
- Los Angeles Calif Go Ref Bd 5%: 1.11%
- Washington St Go Ref Bd 5%: 1.10%
- San Francisco Calif City & Cnt Ref Co 5%: 1.08%
- Columbus Ohio Various P 4%: 1.01%
- New Jersey St Go Bds 5%: 1.01%
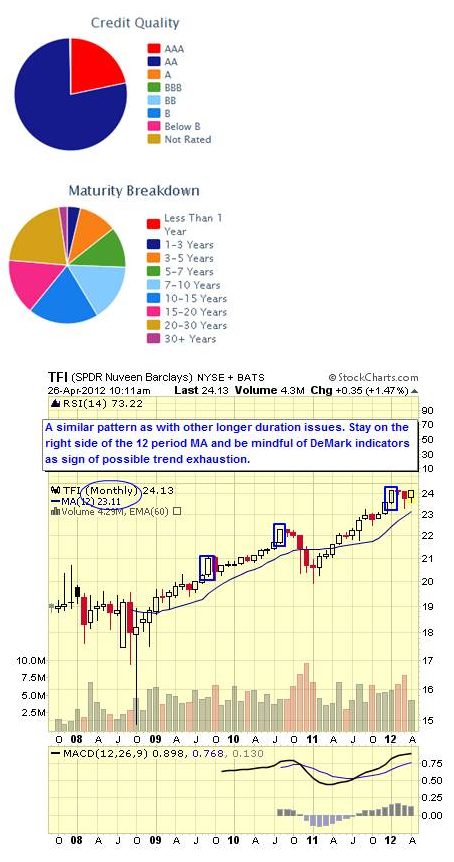
#5: Invesco PowerShares Insured Municipal Bond ETF (PZA)****
PZA follows the BofA Merrill Lynch National Insured Long-Term Core Plus Municipal Securities Index which follows AAA rated, insured, tax exempt and long-term municipal bonds.
(Note: I wonder how long these S&P insured AAA ratings will last. One thing I was taught decades ago was to always look at the underlying rating versus the insured rating. It became a little too common here with the advent of municipal bond mutual funds to insure “everything” like S&P did with mortgages—just an advisory.)
The fund was launched in October 2007. The expense ratio is 0.28%. AUM equal $682M and average daily trading is 216K shares. As of April 2012 the annual dividend yield was 4.73% and YTD return was 3.92%. The one year return was 16.36%.
Data as of April 2012
PZA Top Ten Holdings & Weightings
- Wisconsin St Health & Edl Facs Rev Bd 5%: 3.52%
- Miami-Dade Cnty Fla Wtr & Swr Wtr Swr 5%: 3.47%
- North Tex Twy Auth 5.75%: 2.65%
- New Jersey St Transn Tr Fd Aut Tran 5.5%: 2.54%
- Arizona Health Facs Auth 5%: 2.47%
- Pueblo Cnty Colo Ctfs Partn Cops 5%: 2.46%
- Philadelphia Pa Arpt Rev Airport R 5%: 2.42%
- Pittsburg Calif Uni Sch Dist 5.5%: 2.09%
- Chicago Ill Go Bds 5%: 1.93%
- Garden St N J Preservation Tr Open 5.75%: 1.82%
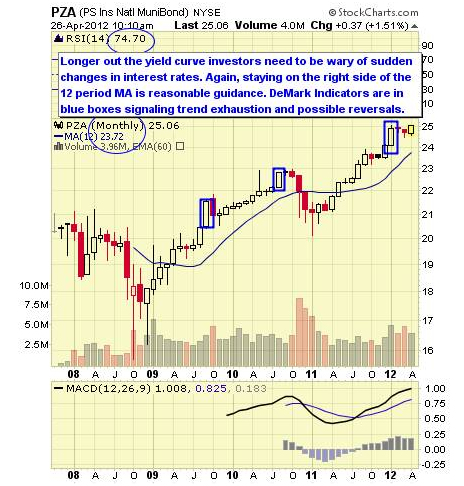
#4: SPDR Short-term Muni ETF (SHM)****
SHM follows the Barclays Capital Managed Money Municipal Short Term Index which is a rules-based, market-value weighted index comprised of publicly traded municipal bonds that cover the U.S. dollar denominated short term tax exempt bond market, including state and local general obligation bonds, revenue bonds, insured bonds, and pre-refunded bonds. The fund was launched in October 2007. The expense ratio is 0.20%.
AUM equal $1.5M and average daily trading volume is 440K shares. As of April 2012 the annual dividend yield was 1.24% and YTD return was 0.04%. The one year return was 2.77%. SHM trades commission free at TD Ameritrade.
Data as of April 2012
SHM Top Ten Holdings & Weightings
- Virginia Comwlth Transn Brd Tr Trans 5%: 1.25%
- Montgomery Cnty Md Pub Impt 5%: 1.24%
- Arkansas St Fed Hwy G 4%: 1.23%
- Maryland St Go Bds 5%: 1.14%
- South Carolina St Go St Hig 4%: 1.11%
- Houston Tex Util Sys Rev Comb Util 5%: 1.08%
- New York St Go Bds 3%: 1.05%
- Connecticut St Go Bds 5%: 1.02%
- Ohio St Major New St Infrastru Rev Bd 5%: 1.01%
- New Jersey St Go Ref Bd 5%: 0.96%
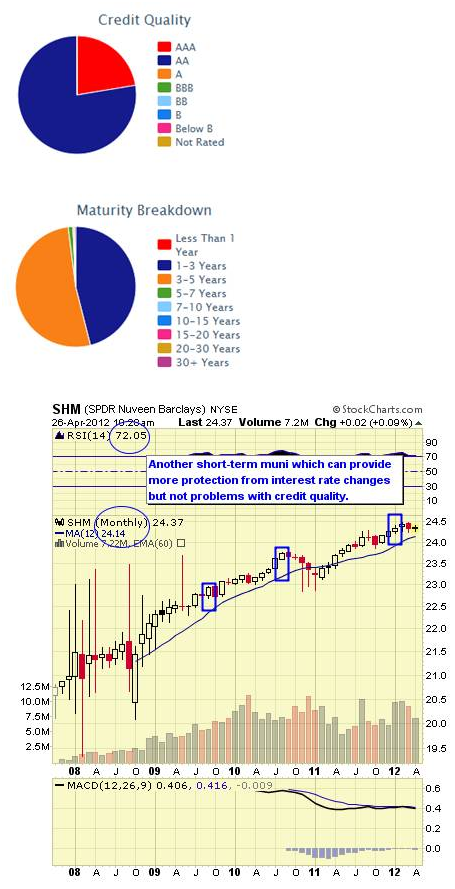
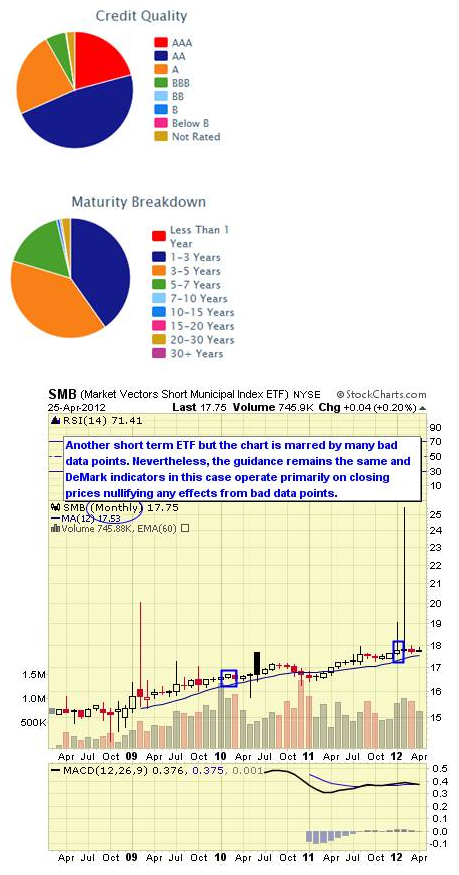
#3: Van Eck Market Vectors Short Municipal Index ETF (SMB)****
SUB follows the Barclays Capital AMT-Free Short Continuous Municipal Index. The fund was launched on February 2008. The expense ratio is 0.16%. AUM equal $134M and average daily trading volume is 45.5K shares.
As of April 2012 the annual yield was 1.84% and YTD return was 0.87%. The one year return was 5.23%.
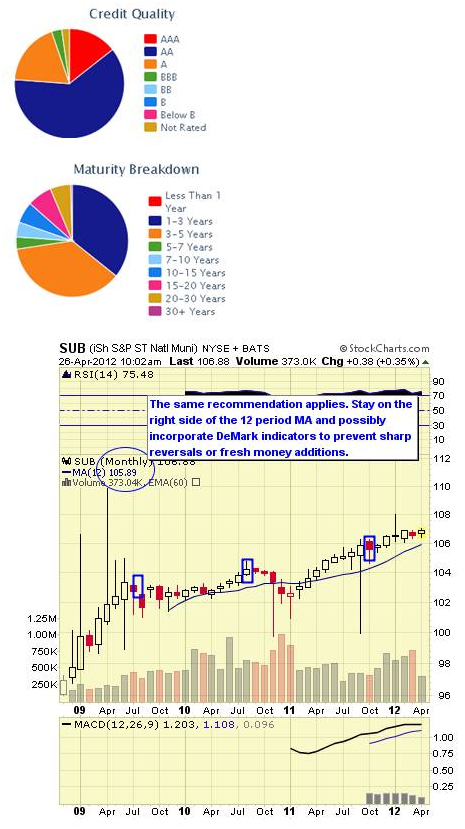
#2: iShares S&P Short-Term National AMT-Free ETF (SUB)****
SUB follows the index of the same name. The fund was launched on November 2008. The expense ratio is 0.25%. AUM equal $527M and average daily trading volume is 30K shares. As of April 2012 the annual yield was 0.94% and YTD return was 0.20%. The one year return was 2.54%.
AMT taxes are a significant issue for many people who are trapped in this category with some not realizing it before it’s too late.
Data as of April 2012
SUB Top Ten Holdings & Weightings
- California Statewide Cmntys De Rev Bd 5%: 1.38%
- California St Dept Wtr Res Pwr Wtr 5.5%: 1.10%
- Memphis Tenn Elec Sys Rev Rev Bds 5%: 0.80%
- Greenville Cnty S C Sch Dist 5.5%: 0.79%
- Connecticut St Go Bds 5%: 0.76%
- Illinois St Toll Hwy Auth 5%: 0.63%
- California St Dept Wtr Res Pwr Pwr Su 5%: 0.60%
- Los Angeles Calif Uni Sch Dist 5%: 0.59%
- Los Angeles Calif Uni Sch Dist 5%: 0.59%
- New Jersey Econ Dev Auth 5%: 0.57%
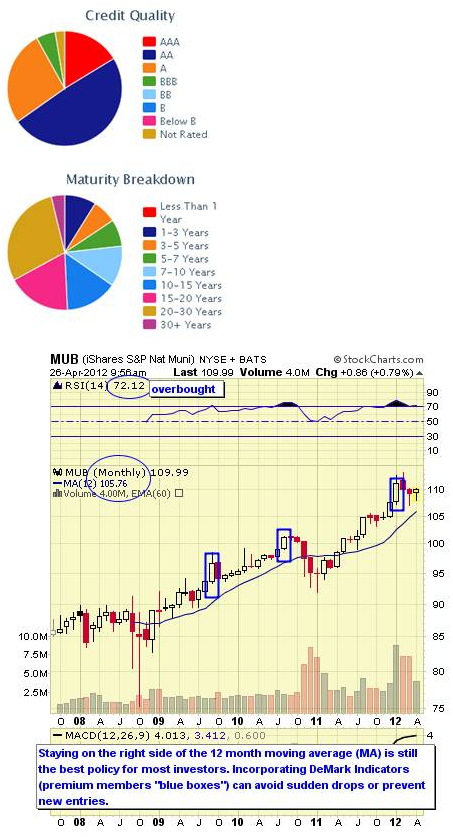
#1: iShares S&P National Municipal Bond ETF (MUB)****
MUB follows the investment grade AMT-free segment of the municipal bonds nationally. The expense ratio is 0.25%. AUM equal $2.8M while average daily trading volume is 339K shares. Despite controversy regarding local governments’ fiscal soundness and some warning of defaults, investors may hate taxes and love tax-free yield more.
As of April 2012 the annual dividend yield is 2.44% and YTD return is 1.47%. The one year return is 11.65%. MUB trades commission free at Fidelity and TD Ameritrade.
Data as of April 2012
MUB Top Ten Holdings & Weightings
- California St Go Bds 6%: 0.70%
- California St Dept Wtr Res Pwr Wtr 5.75%: 0.46%
- Puerto Rico Sales Tax Fing Cor Rev Bd 6%: 0.38%
- North Tex Twy Auth 5.125%: 0.38%
- California St Go Bds 5%: 0.35%
- California Statewide Cmntys De Rev Bd 5%: 0.32%
- Salt River Proj Ariz Agric Imp Elec S 5%: 0.31%
- Greenville Cnty S C Sch Dist 5.5%: 0.31%
- New York N Y Go Bds 5.25%: 0.30%
- Illinois St Toll Hwy Auth 5%: 0.29%
Ratings Explained: We rank the top 10 ETF by our proprietary stars system as outlined below. However, given that we’re sorting these by both short and intermediate issues we have split the rankings as we move from one classification to another so rankings aren’t necessarily in order.
****
- Strong established linked index
- Excellent consistent performance and index tracking
- Low fee structure
- Strong portfolio suitability
- Excellent liquidity
- Established linked index even if “enhanced”
- Good performance or more volatile if “enhanced” index
- Average to higher fee structure
- Good portfolio suitability or more active management if “enhanced” index
- Decent liquidity
- Enhanced or seasoned index
- Less consistent performance and more volatile
- Fees higher than average
- Portfolio suitability would need more active trading
- Average to below average liquidity
- Index is new
- Issue is new and needs seasoning
- Fees are high
- Portfolio suitability also needs seasoning
- Liquidity below average
Municipal bonds are under increasing pressure to avoid default threats articulated by some pundits as likely given weak tax receipts particularly with smaller municipalities and revenue bond structures. General obligation bonds require the issuer to raise taxes and/or cut spending to meet interest and principal payments as holders stand first in line even ahead of salaries to bureaucrats and civil servants.
We do see some consistent overbought conditions which shouldn’t be ignored completely. Nevertheless strong trends like this can overpower any sound technical strategies including long-term DeMark indicators.
As stated with other sectors, remember ETF sponsors must issue and their interests aren’t necessarily aligned with yours. They have a business interest and wish to have a competitive presence in any popular sector.
Disclosure: No positions in featured ETFs
