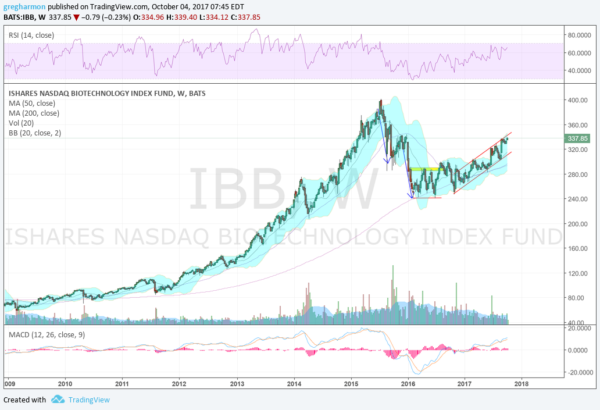
From the market low in 2009 Biotech stock led the way higher like a double helix. A slow move at first off of the 200 week SMA for the Biotech Index ETF (NASDAQ:IBB), that gathered steam into 2013. The strength of the run then found minor pullbacks to the 50 week SMA as support held. The Biotech Index then rode that 50 week SMA higher to a peak in July 2015. In all the Index had gained over 560% in a little over 6 years. Were you on that train?
The next 6 months was painful though as the Biotech Index dropped over 40% back to its 200 week SMA. The two step process shock out many holders. Momentum reset during that correction as well. And the ETF then consolidated for what seemed like forever. Six months of sideways action and then a breakout to the upside. but that quickly failed as it hit the 50 week SMA, this time as resistance. Back to the 200 week SMA and support again.
It rode the 200 week SMA higher until it met the 50 week SMA. Then in early 2017 the ETF crossed over the 50 week SMA and has continued to ride it higher as support, in a channel ever since. It now is at the top of the channel and is attracting a lot of attention as it retraces 61.8% of the drop. Is there more in the tank? Or does it need bed rest?
For the intermediate term investor the rising channel is a positive. And the rising momentum indicators also support more upside price action. Either a break of the channel to the upside, or a pullback to the bottom of the channel that holds and then reverses would be good entry points. If you are comfortable with options, then you could also enter now with a Married Put strategy, protecting the downside to the bottom of the channel.
DISCLAIMER: The information in this blog post represents my own opinions and does not contain a recommendation for any particular security or investment. I or my affiliates may hold positions or other interests in securities mentioned in the Blog, please see my Disclaimer page for my full disclaimer.

