Toll Brothers, Inc. (TOL) designs, builds, markets and arranges financing for single-family detached and attached homes in luxury residential communities. The Company is also involved, directly and through joint ventures, in projects where it is building, or converting rental apartment buildings into, high-, mid- and low-rise luxury homes.
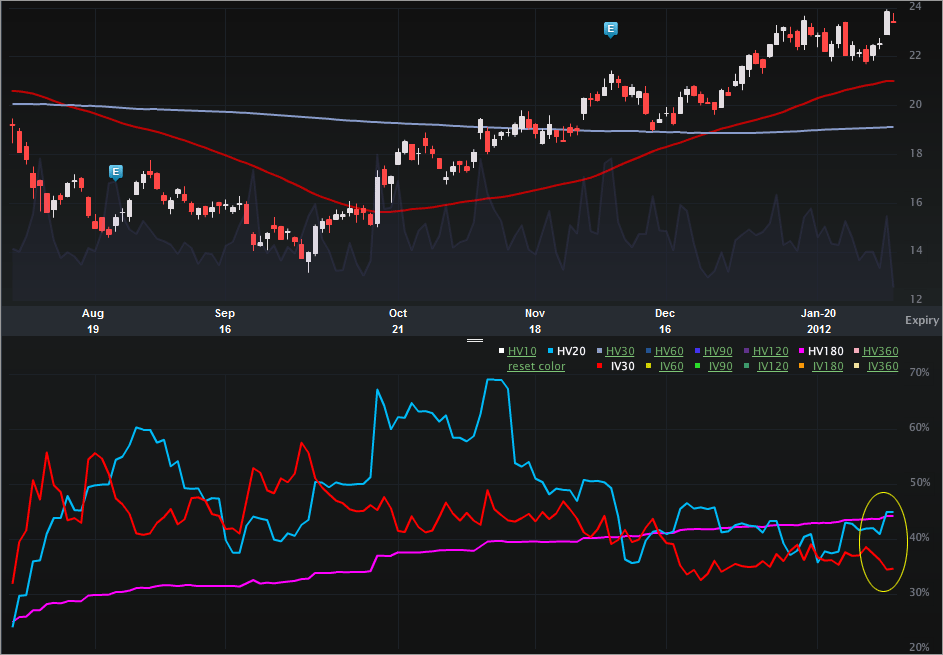
This is a vol note -- specifically depressed vol into earnings and an interesting vol comp. Let's start with the Charts Tab (six months), below. The top portion is the stock price, the bottom is the vol (IV30™ - red vs HV20™ - blue vs HV180™ - pink).
On the stock side, we can see how the underlying has been increasing rather abruptly since the lows in mid Oct. In fact, the stock is up ~67% since that time as of this writing.
On the vol side, we can see how the implied has been dipping as the stock has been rising. In that same time period when the stock has risen 67%, the IV30™ has dropped from 55.68% to 34.64% or a 38% drop. The 52 wk range in IV30™ is [24.25%, 57.54%], putting the current level in the 31st percentile. As far as I can tell, the next earnings release for TOL should be at the end of Feb -- outside of Feb expiry but inside Mar.
Not only is the implied trading in the lower third for the year while earnings are near, but it's also trading below the two historical measures I like to use. Specifically:
IV30™: 34.64%
HV20™: 44.94%
HV180™: 44.20%
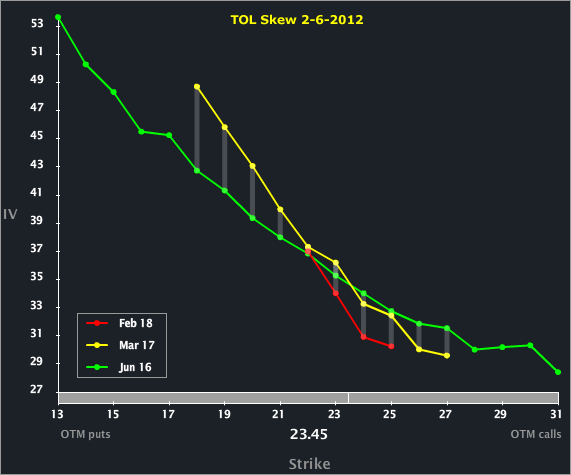
Let's turn to the Skew Tab, below.
We can see all of the front three months have a similar shape -- nothing unusual there. We can also see that the Mar ATM is priced above the other two expiries, which makes sense given the earnings event. What is a bit weird, or maybe interesting, is how close the Feb and Mar options are priced in vol.
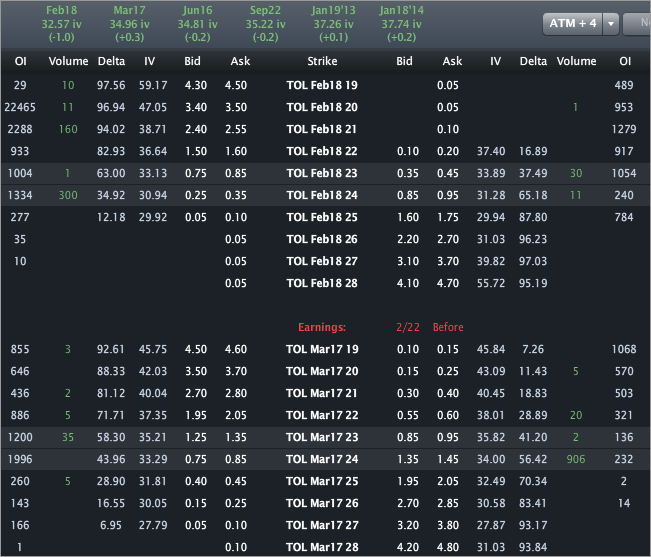
Let's turn to the Options Tab for completeness.
We can see Feb is priced to 32.57% vol while Mar is priced to 34.96%. Looking specifically at the ATM vols, we can see ~33.5% and ~35.5% for Feb and Mar, respectively.
This is trade analysis, not a recommendation.
- English (UK)
- English (India)
- English (Canada)
- English (Australia)
- English (South Africa)
- English (Philippines)
- English (Nigeria)
- Deutsch
- Español (España)
- Español (México)
- Français
- Italiano
- Nederlands
- Português (Portugal)
- Polski
- Português (Brasil)
- Русский
- Türkçe
- العربية
- Ελληνικά
- Svenska
- Suomi
- עברית
- 日本語
- 한국어
- 简体中文
- 繁體中文
- Bahasa Indonesia
- Bahasa Melayu
- ไทย
- Tiếng Việt
- हिंदी
Toll Brothers: Depressed Vol Into Earnings
Published 02/07/2012, 12:43 AM
Updated 07/09/2023, 06:31 AM
Toll Brothers: Depressed Vol Into Earnings
Latest comments
Loading next article…
Install Our App
Risk Disclosure: Trading in financial instruments and/or cryptocurrencies involves high risks including the risk of losing some, or all, of your investment amount, and may not be suitable for all investors. Prices of cryptocurrencies are extremely volatile and may be affected by external factors such as financial, regulatory or political events. Trading on margin increases the financial risks.
Before deciding to trade in financial instrument or cryptocurrencies you should be fully informed of the risks and costs associated with trading the financial markets, carefully consider your investment objectives, level of experience, and risk appetite, and seek professional advice where needed.
Fusion Media would like to remind you that the data contained in this website is not necessarily real-time nor accurate. The data and prices on the website are not necessarily provided by any market or exchange, but may be provided by market makers, and so prices may not be accurate and may differ from the actual price at any given market, meaning prices are indicative and not appropriate for trading purposes. Fusion Media and any provider of the data contained in this website will not accept liability for any loss or damage as a result of your trading, or your reliance on the information contained within this website.
It is prohibited to use, store, reproduce, display, modify, transmit or distribute the data contained in this website without the explicit prior written permission of Fusion Media and/or the data provider. All intellectual property rights are reserved by the providers and/or the exchange providing the data contained in this website.
Fusion Media may be compensated by the advertisers that appear on the website, based on your interaction with the advertisements or advertisers.
© 2007-2025 - Fusion Media Limited. All Rights Reserved.
