Oil price is melting down like there's no tomorrow. How else could we describe the bloodbath? Fresh monthly lows being hit on a daily basis. Slicing through important supports. With such a weak close to the trading week, how will black gold fare the next one? Clearly, the most recent Mexico tariff announcement hasn't helped and it's widely felt in the markets, including this one. Better news on the horizon?
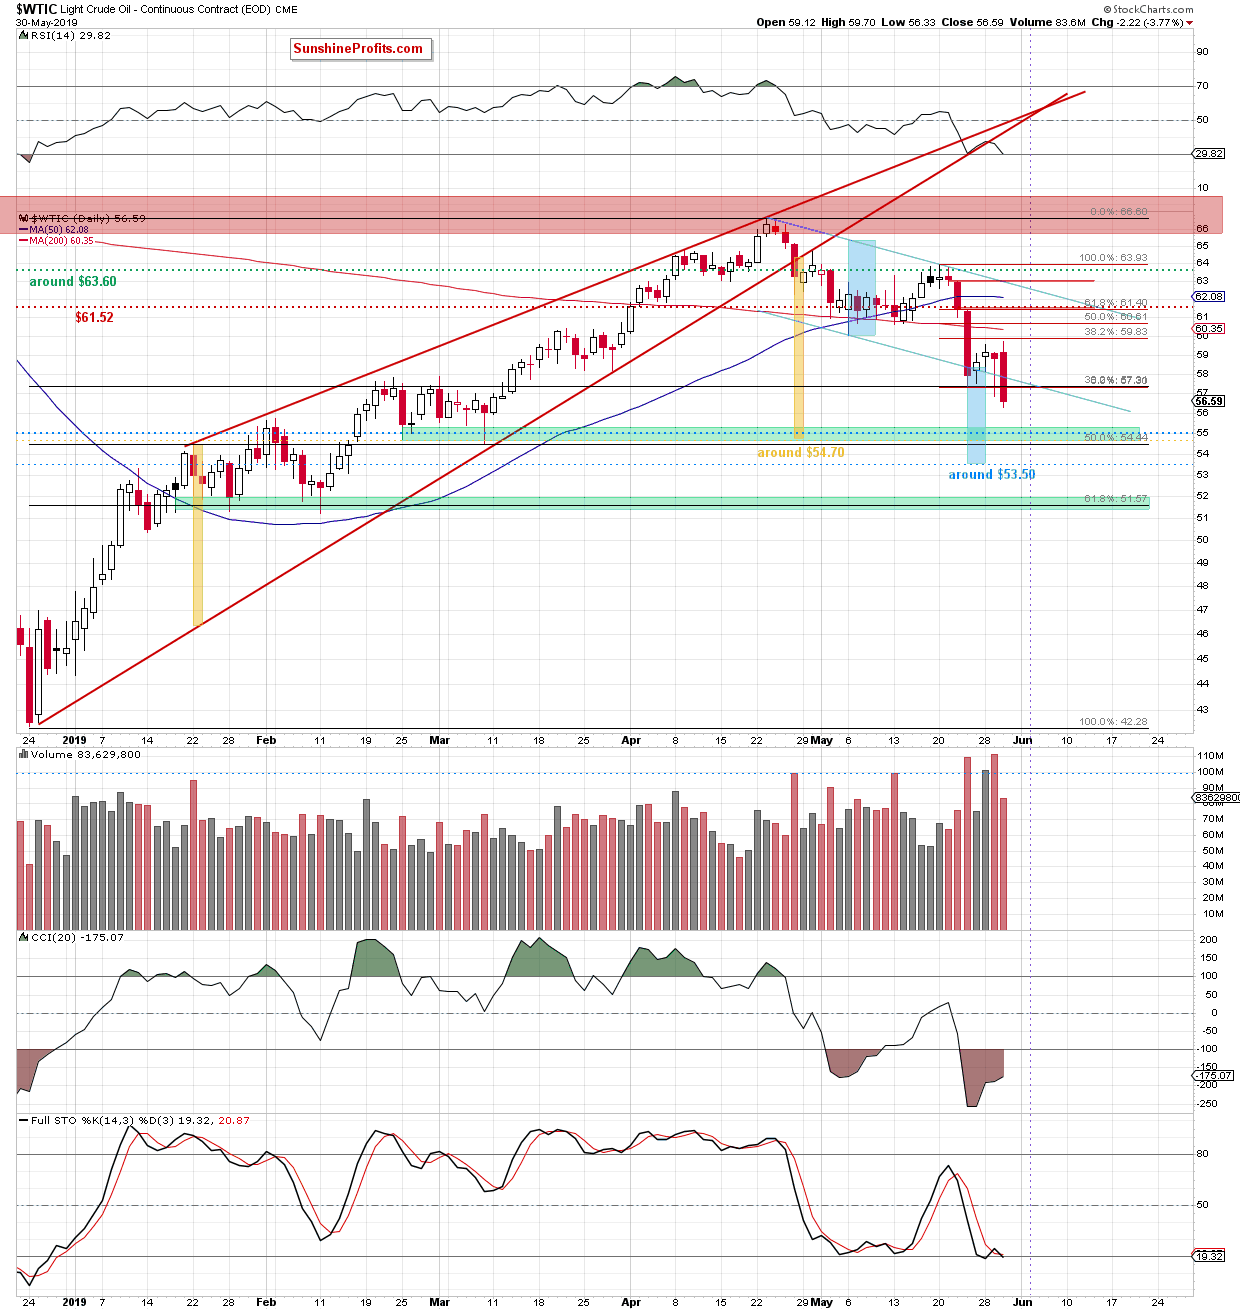
Let's take a closer look at the chart below (charts courtesy of http://stockcharts.com and www.stooq.com).

We wrote these words Friday:
(...) After hitting a fresh May low, black gold (...) rose not only above last week's lows, but also returned back inside the declining blue trend channel.
This way, crude oil has invalidated two earlier breakdowns. While this may seem bullish on the surface, (...) we have already seen something similar not so long ago.
(...) the breakout attempt above the 38.2% Fibonacci retracement evaporated. Such a swift reversal increases the likelihood of further deterioration targeting at least a test of the lower border of the blue declining trend channel in the very near future.
The bulls have been unable to reach the 38.2% Fibonacci retracement and Crude Oil price went on to slide below previous day's intraday lows.
Black gold has closed the day not only below Wednesday's lows but also below the 38.2% Fibonacci retracement (marked with green). The situation doesn't look good for the bulls in the coming day(s).
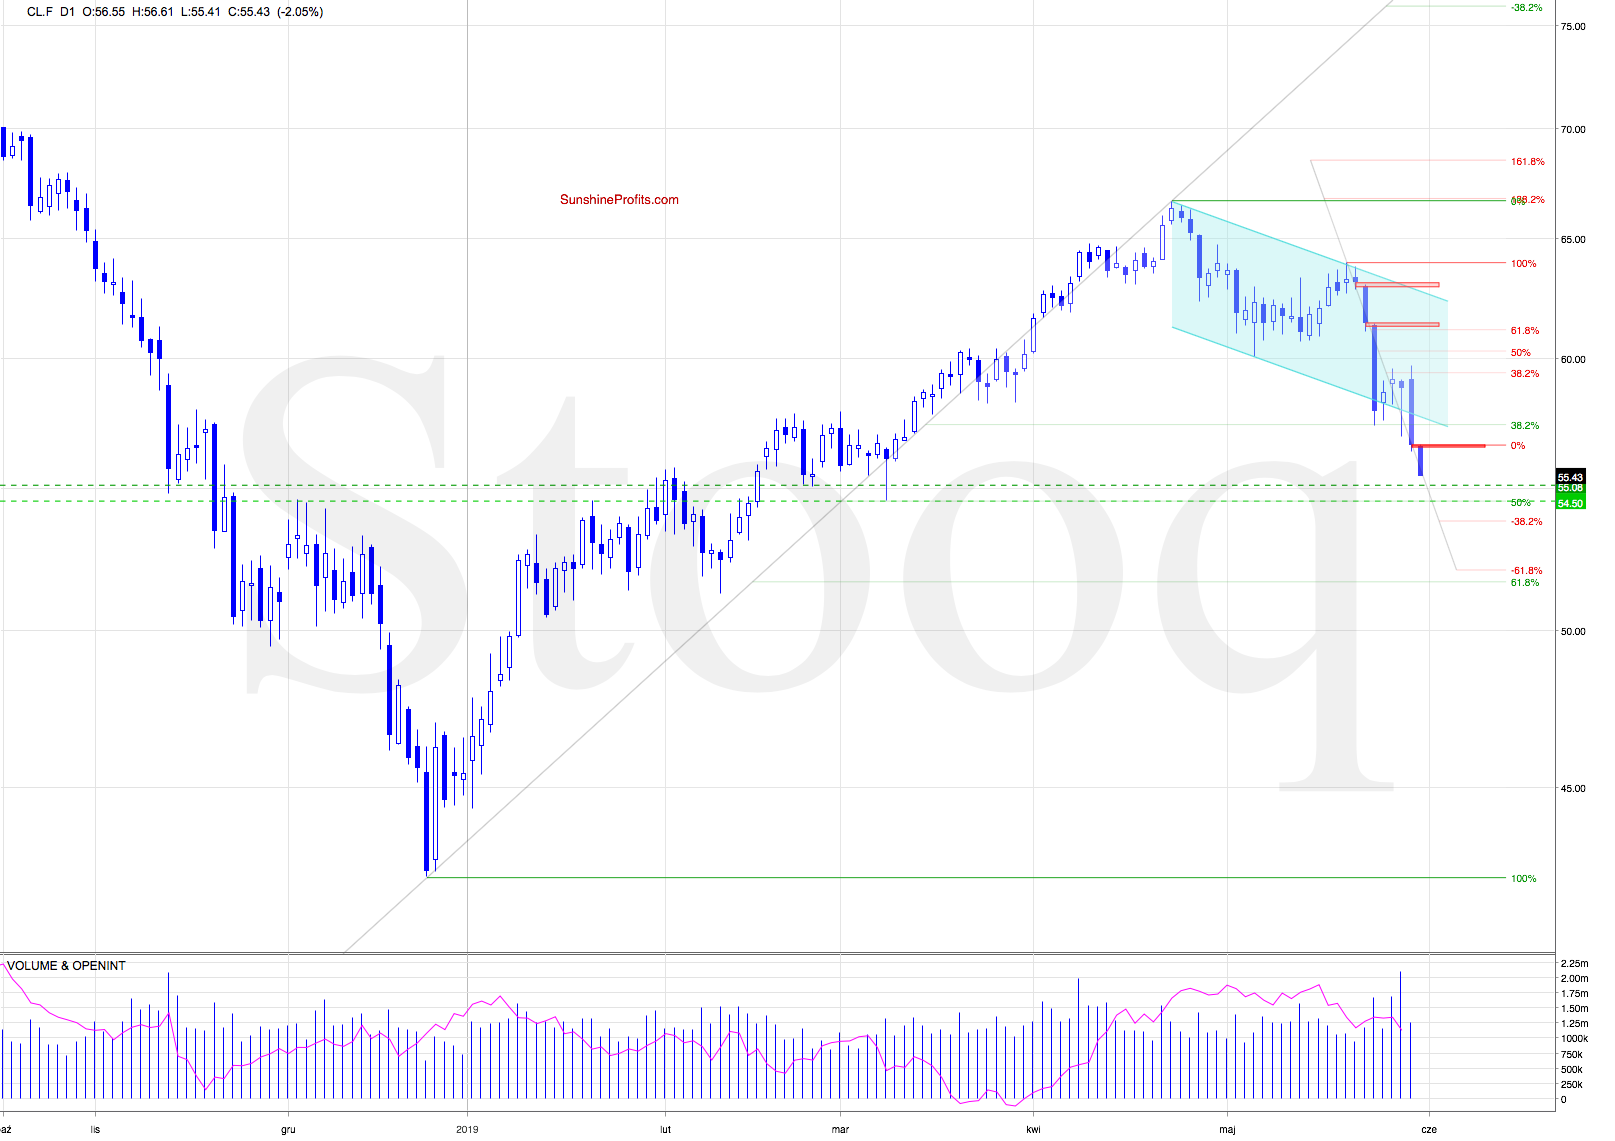
This view is supported by looking at today's crude oil futures action so far:

Light crude has opened today with another red gap. The losing streak continues and the bearish overtones are very much on - just look at the current oil price of $55.00 approximately. It's a fresh May low, approaching our next downside target - the green support zone based on the 50% Fibonacci retracement and the late-February lows.
Should the commodity continue on its downward path, it's high time to think about the downside targets. Let's remember these words:
(...) If the commodity extends losses from here, we could see a drop even to around $53.50, where the size of the decline corresponds to the height of the channel.
But the first target for the sellers will be a bit higher - at around $54.70, where the size of the downward move equals the height of the rising red wedge (as marked with yellow rectangles).
A parting thought: there is a fitting saying in the trading world for such a determined price action as we're looking at in oil right now. It says "never try to catch a falling knife". Food for thought.
Summing up, the outlook for oil is bearish. On Friday, the bulls were been unable to stop the bearish momentum as they have managed to do on Wednesday. Black gold continues to trade lower, making our short position increasingly profitable - literally day by day. The weekly indicators and volume comparison continue to support lower prices and the daily picture concurs. Our downside targets are within a spitting distance and the short position continues to be justified.
