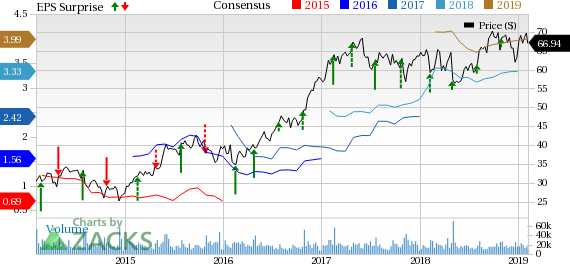
T-Mobile US, Inc. (NYSE:S) reported solid fourth-quarter 2018 results driven by record-high service revenues, along with all-time high total revenues and adjusted EBITDA. Both the top line and the bottom line surpassed the respective Zacks Consensus Estimate in the quarter.
Net Income
Net income for the reported quarter came in at $640 million or 75 cents per share compared with $2,707 million or $3.11 per share in the year-ago quarter. The significant year-over-year decrease, despite higher revenues, was primarily attributable to income tax benefit realized in the year-ago quarter. The bottom line beat the Zacks Consensus Estimate by 6 cents.
For full year 2018, net income declined to 2,888 million or $3.36 per share from $4,536 million or $5.20 per share in 2017.
Revenues
Quarterly total revenues increased 6.4% year over year to a record-high $11,445 million, primarily driven by record service revenues, best postpaid phone growth in the industry with record 2.4 million total net additions and record-low Q4 postpaid phone churn (0.99%). The top line surpassed the Zacks Consensus Estimate of $11,414 million.
For full year 2018, revenues improved to $43,310 million from $40,604 million in 2017.
Segmental Performance
Total Service revenues were up 6% for a record high of $8,238 million, which marked the 19th consecutive quarter of leading the industry in a year-over-year service revenue percentage growth. Within the Service segment, branded postpaid revenues were $5,384 million, increasing 8% year over year.
The company registered 1.4 million branded postpaid net additions and 1 million branded postpaid phone net additions in the quarter, both metrics being the best in the industry. Branded postpaid phone average revenue per user (ARPU) remained stable at $46.29. Branded prepaid revenues were $2,399 million, up 1.2% year over year.
Branded prepaid ARPU remained steady at $38.39. Wholesale revenues were $304 million, down 6.2% while Roaming and other service revenues were $102 million, up 29.1%.
Revenues from Equipment totaled $2,940 million, up 8.6% year over year. Other revenues were $316 million, up 7.5%.
Other Financial Metrics
T-Mobile reported record fourth-quarter adjusted EBITDA of $2,970 million compared with $2,711 million in the prior-year quarter on higher operating income, which increased to $1,137 million from $1,112 million in the year-ago quarter.
Cash Flow and Liquidity
For 2018, T-Mobile generated $3,899 million of cash from operations compared with $3,831 million in the year-ago period. Free cash flow for 2018 was $3,552 million compared with $2,725 million in the year-ago period.
As of Dec 31, 2018, the company had $1,203 million of cash and cash equivalents with long-term debt of $12,124 million compared with the respective tallies of $1,219 million and $12,121 million in the prior-year period.
Outlook
With record quarterly results, T-Mobile offered a bullish guidance for 2019 with expectation of branded postpaid net customer additions to 2.6-3.6 million. Adjusted EBITDA is expected between $12.7 billion and $13.2 billion. Cash purchases of property and equipment, excluding capitalized interest, are expected at the higher end of $5.8-$6.1 billion range.
The three-year (2016-2019) compound annual growth rate guidance for net cash provided by operating activities is expected to be within 17-21%, while free cash flow is expected to be within 46-48%.
Moving Ahead
T-Mobile will likely drive its business with solid performances as it has cleared most of the regulatory and shareholder approvals for its pending merger with Sprint Corp. (NYSE:S) . This is a step forward in creating the New T-Mobile through which it will bring robust competition to the 5G era. Its customer growth will continue to accelerate, benefiting from the investments in network and in customer experience.
The company boasts one of the fastest LTE networks in the industry realizing average 4G LTE download speeds of 33.4 Mbps, and average 4G LTE upload speeds of 12.1 Mbps. Covering more than 325 million people with 4G LTE, T-Mobile is building out standards-based 5G across the country, including six of the top 10 markets. We remain impressed with the solid growth potential of the company.
Zacks Rank and Stocks to Consider
T-Mobile currently has a Zacks Rank #3 (Hold). Better-ranked stocks in the industry include ATN International, Inc. (NASDAQ:ATNI) and Liberty Latin America Ltd. (NASDAQ:LILA) , both carrying a Zacks Rank #2 (Buy). You can see the complete list of today’s Zacks #1 Rank (Strong Buy) stocks here.
ATN International surpassed earnings estimates thrice in the trailing four quarters, the average positive surprise being 138.1%.
Liberty Latin America is trading at a forward P/E of 27x.
Zacks' Top 10 Stocks for 2019
In addition to the stocks discussed above, wouldn't you like to know about our 10 finest buy-and-holds for the year?
From more than 4,000 companies covered by the Zacks Rank, these 10 were picked by a process that consistently beats the market. Even during 2018 while the market dropped -5.2%, our Top 10s were up well into double-digits. And during bullish 2012 – 2017, they soared far above the market's +126.3%, reaching +181.9%.
This year, the portfolio features a player that thrives on volatility, an AI comer, and a dynamic tech company that helps doctors deliver better patient outcomes at lower costs.
See Stocks Today >>
Sprint Corporation (S): Get Free Report
ATN International, Inc. (ATNI): Free Stock Analysis Report
Liberty Global (NASDAQ:LBTYA) PLC (LILA): Free Stock Analysis Report
T-Mobile US, Inc. (TMUS): Get Free Report
Original post
Zacks Investment Research

