
I have started the New Year with a quick review of long-term charts of different asset classes. This year I am going to take a closer look at one of them from a swing trader perspective on a weekly basis. Let’s begin with US Treasury Bonds.
The first time I wrote about the volatility collapse in the 20-year Treasury Bond ETF (TLT) on Dec 14th and followed the TLT price action since then. To catch up you can read the last update here.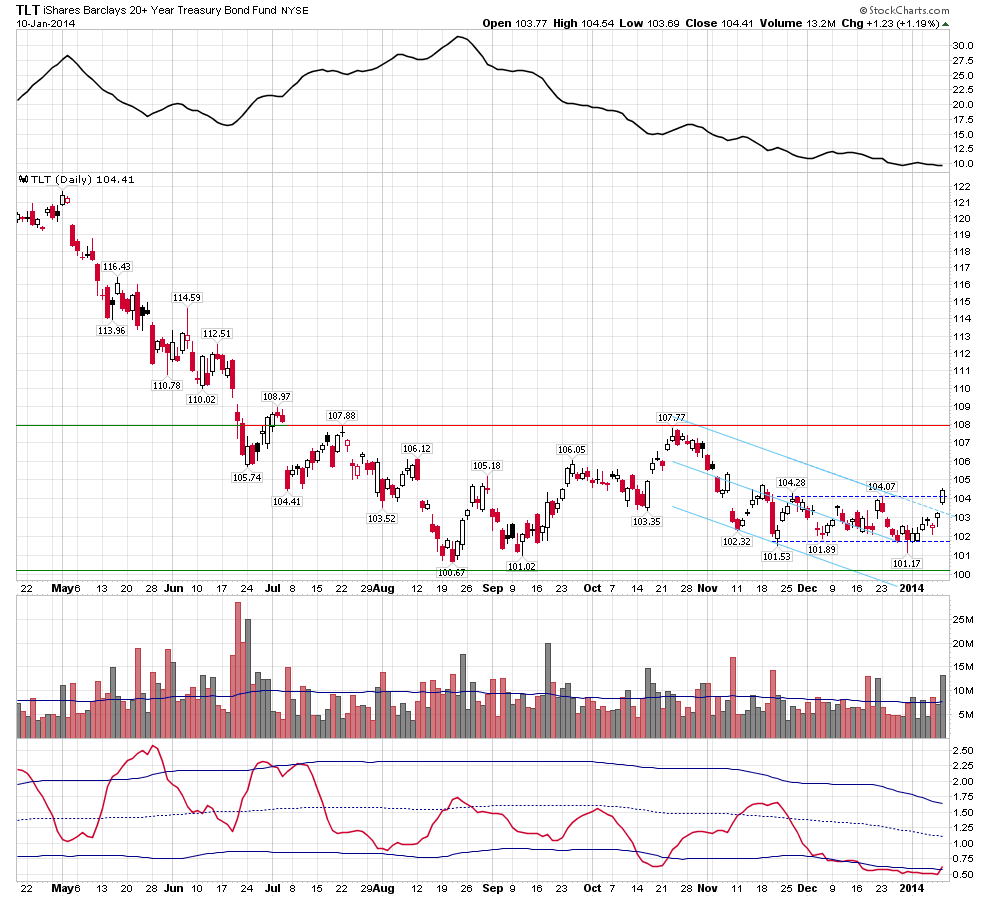
Since that time TLT made an attempt to break down through the 102 support level on average volume on Dec 31st but snapped back and closed within the limits of a 1-month rectangle pattern on the same day. After that TLT began moving upward to the rectangle upper border. On Jan 10th price gapped above the declining Raff Regression Channel and moved up all day with the close above the rectangle upper boundary on above average volume. The standard deviation (20) turned higher (lower indicator window) confirming a breakout from the tight price range. It looks like a valid reversal of the short-term downtrend. Note, however, that potential higher prices can still be a part of a bigger consolidation pattern which is unfolding between 100 and 108. The ADX (20) is still showing a lack of trend (upper indicator window). 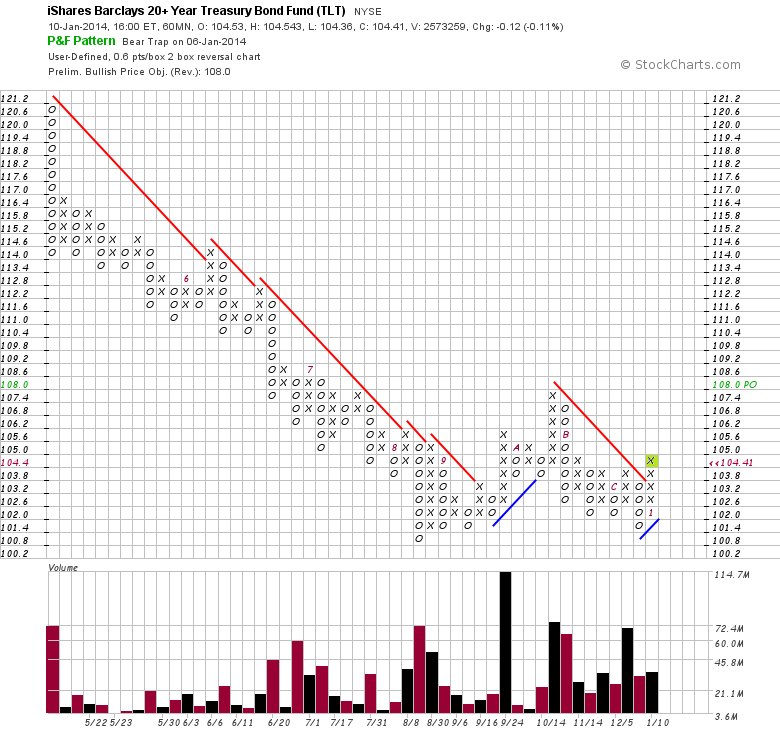
The short horizon 0.6x2 P&F chart generated a Triple Top buy signal (lime box) confirming the breakout through the declining Bearish Resistance line. Note also that all X columns during the November-December consolidation were built on bigger volume than O columns. The breakout X column is also higher than the previous columns in the pattern – an indication of increasing demand. The price has a potential to go higher up to the 107.5-108 resistance area from here.
Disclosure: On Jan 3rd I opened a Reverse Iron Condor Spread (100-101-103-104). This neutral options strategy is used when a trader is bullish on volatility and the underlying stock can move in either direction.
Disclaimer: I express only my personal opinion on the market and do not provide any trading or financial advice (see Disclaimer on my site).
- English (UK)
- English (India)
- English (Canada)
- English (Australia)
- English (South Africa)
- English (Philippines)
- English (Nigeria)
- Deutsch
- Español (España)
- Español (México)
- Français
- Italiano
- Nederlands
- Polski
- Português (Portugal)
- Português (Brasil)
- Русский
- Türkçe
- العربية
- Ελληνικά
- Svenska
- Suomi
- עברית
- 日本語
- 한국어
- 简体中文
- 繁體中文
- Bahasa Indonesia
- Bahasa Melayu
- ไทย
- Tiếng Việt
- हिंदी
TLT: Short-Term Downtrend Reversal
Published 01/13/2014, 12:29 AM
Updated 07/09/2023, 06:31 AM
TLT: Short-Term Downtrend Reversal
Latest comments
Loading next article…
Install Our App
Risk Disclosure: Trading in financial instruments and/or cryptocurrencies involves high risks including the risk of losing some, or all, of your investment amount, and may not be suitable for all investors. Prices of cryptocurrencies are extremely volatile and may be affected by external factors such as financial, regulatory or political events. Trading on margin increases the financial risks.
Before deciding to trade in financial instrument or cryptocurrencies you should be fully informed of the risks and costs associated with trading the financial markets, carefully consider your investment objectives, level of experience, and risk appetite, and seek professional advice where needed.
Fusion Media would like to remind you that the data contained in this website is not necessarily real-time nor accurate. The data and prices on the website are not necessarily provided by any market or exchange, but may be provided by market makers, and so prices may not be accurate and may differ from the actual price at any given market, meaning prices are indicative and not appropriate for trading purposes. Fusion Media and any provider of the data contained in this website will not accept liability for any loss or damage as a result of your trading, or your reliance on the information contained within this website.
It is prohibited to use, store, reproduce, display, modify, transmit or distribute the data contained in this website without the explicit prior written permission of Fusion Media and/or the data provider. All intellectual property rights are reserved by the providers and/or the exchange providing the data contained in this website.
Fusion Media may be compensated by the advertisers that appear on the website, based on your interaction with the advertisements or advertisers.
© 2007-2025 - Fusion Media Limited. All Rights Reserved.