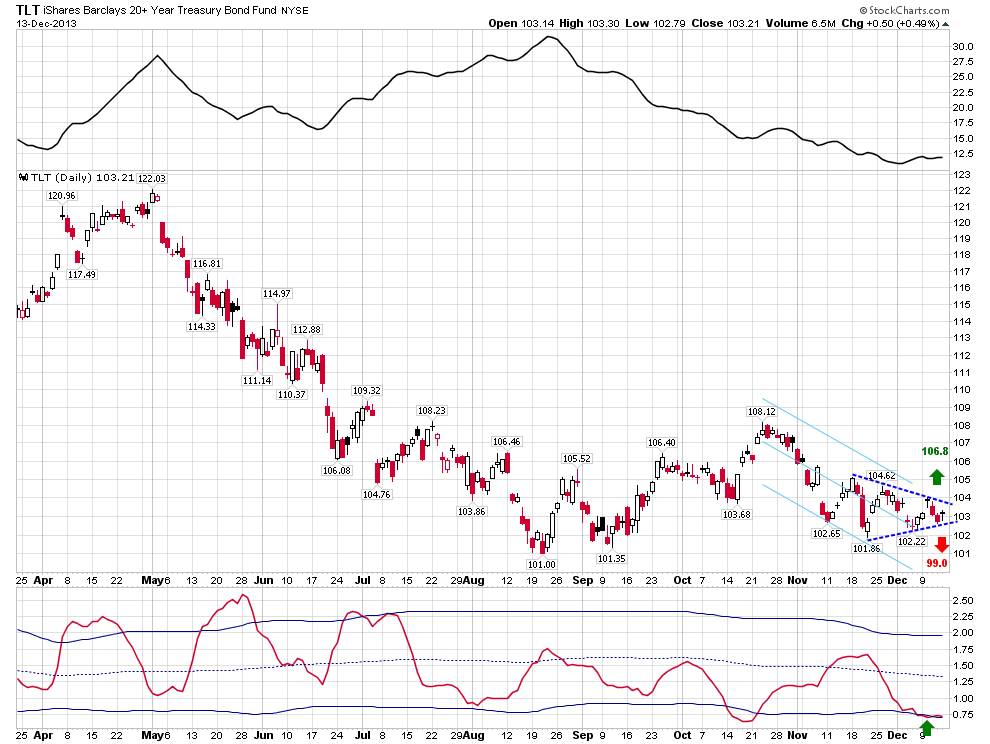
The 20+ Year Treasury Bond ETF (TLT) has been trending sideways for the last month forming a symmetrical triangle pattern. TLT remains within the limits of the short-term declining Raff Regression Channel from the October top and the forming triangle may be considered as a continuation pattern. However, we should take into account the bigger picture also.
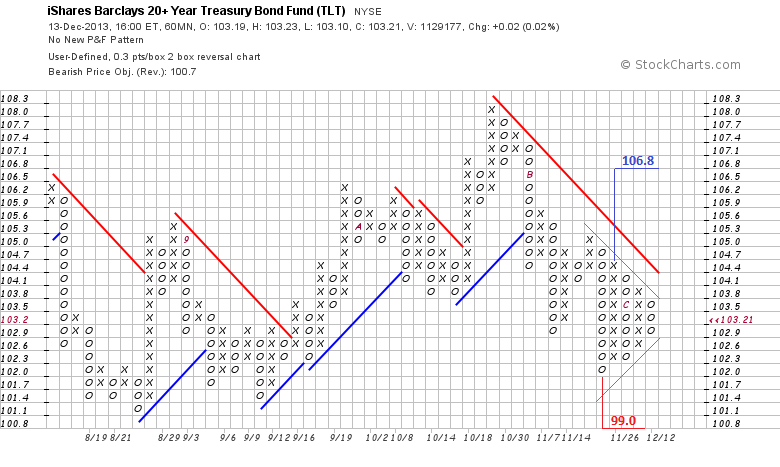
The ADX (20) in the upper window has been declining since late August. The indicator is still showing a non-trending period, so there is a possibility that the October-December leg down is a part of the bigger lateral movement rather than a continuation of the May-August down trend. In this case the symmetrical triangle can be resolved to the upside. Anyway, the 20-day standard deviation in the lower window shows that volatility has collapsed and we should expect a strong directional move soon. Vertical counts on the short horizon 0.3x2 P&F chart point that a breakout has the potential upside target at 106.8 and downside target at 99. 
Disclaimer: I express only my personal opinion on the market and do not provide any trading or financial advice (see Disclaimer on my site).
