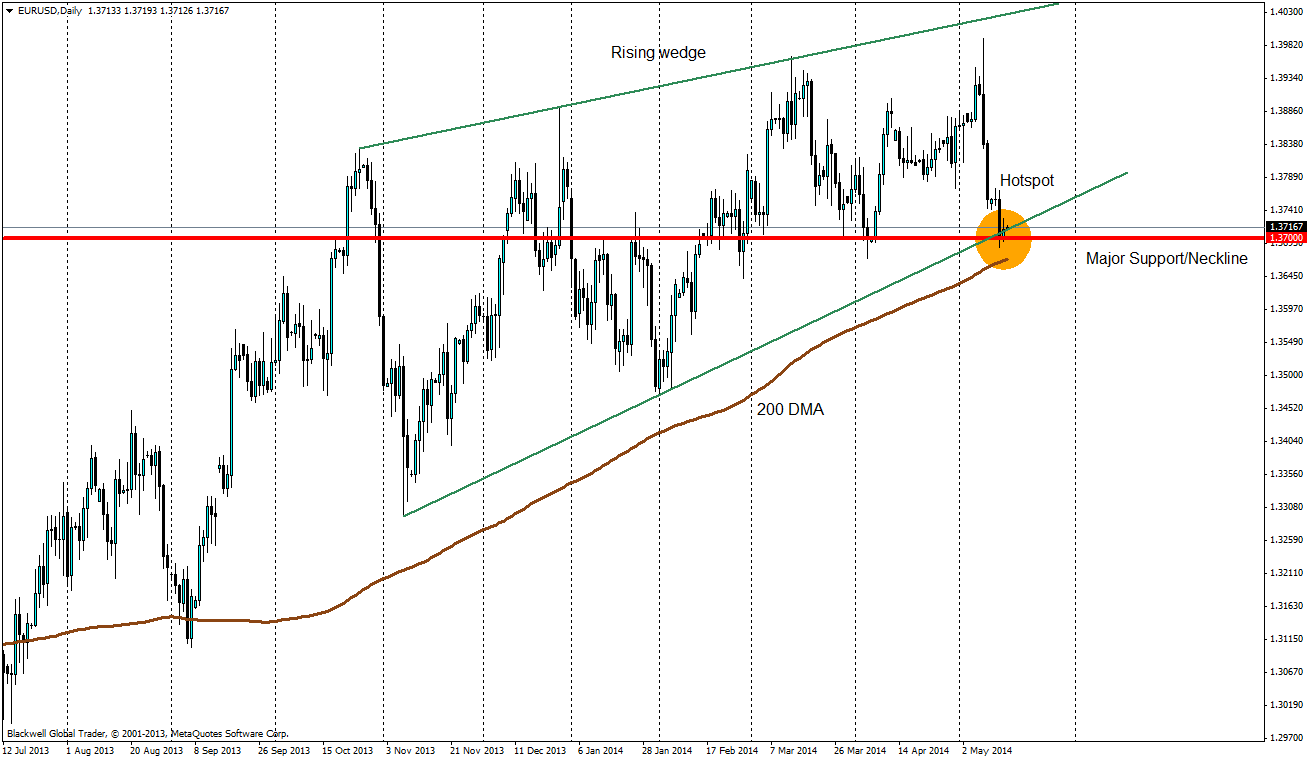
After its huge impulsive sell off, the EUR/USD is currently taking a breather at the 1.3700 zone, a major support level. I would like to draw your attention to the fact that price action is in a critical zone with multiple areas of convergence. Many technical plays can emerge from this and I would like to outline the possibilityof a mid-long term bearish reversal play.

Source: Blackwell Trader
First off, the very backbone of my analysis lies in the D1 chart. The overall structure of the EUR/USD is still bullish but having said that, I am very wary of an imminent reversal. Here’s why:
-
Rising Wedge Pattern
This has formed over the past 5 months and price is currently testing the base of the wedge. A rising wedge is a bearish reversal pattern as there is a loss of upside momentum with each successive high.
-
Double Top
After the recent impulsive bearish moves, price is testing the major support zone of 1.37 which incidentally is also the neckline of a double top – another warning sign of a possible reversal
-
Impulsive Bear Candles
The size and strength of the bear candles from the 08/05/14 is notable as it has successfully engulfed 1 month of price action, culling many bulls in the process. Any staunch bulls would be eliminated on a strong break of the support and a close below the 200DMA, as we should expect the remainder of bullish stops to be tagged.
That is why the EUR/USD is on my watch-list with special attention to what happens within the marked Hotspot. Do keep in mind that since the hotspot is in a major support zone, we can expect a final fight from the stubborn bulls. I am holding out on putting in any shorts at the moment till the market shakes off all the bulls.
Intraday/Short term opportunities
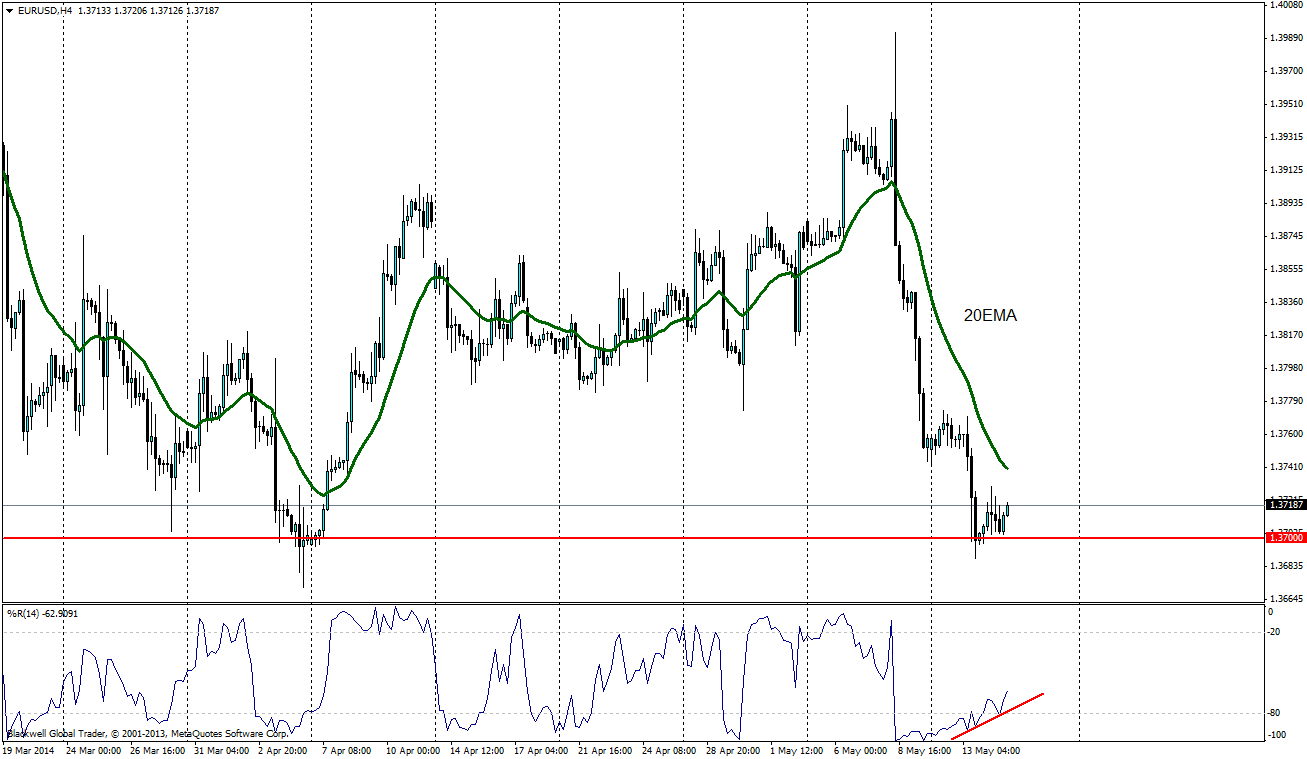
Looking at the smaller timeframes, we can take advantage of that last standoff between the bulls and the bears by placing long orders with tight stops. Let me bring your attention to the EUR/USD H4 chart:

Presently, there is a technical divergence in play. We observe price in a down trend firmly below the 20EMA. However, taking a look at the 14-period Williams %R, we see higher lows being formed with increasing upward momentum,with the indicator going past the -80 mark. Traders can take this divergence together with other price action reversal signals in the shorter time frames like the H1 and/or M15 that might appear in today’s trading session for a quick profit. Do keep in mind that there will be some volatility during the release of EUR CPI, US CPI and US employment data.
