Focus the last few months has been on oil. It looks to have finally reached a bottom and reversed. Moving higher with fits and starts it is now approaching $50 per barrel. Remember when it was going to go to $20 or lower? It should not be long before pundits start calling for $100 per barrel and the Saudis all start looking happy again. But with this great recent success in oil there has not been a great move in the Oil Services companies. Is it time for them to turn?
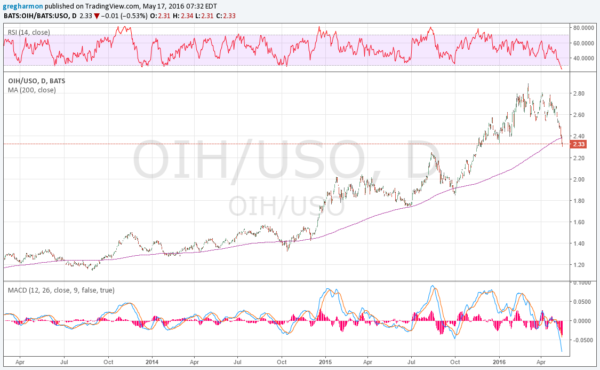
The chart below may give some clues. It is the ratio of the VanEck Vectors Oil Services (NYSE:OIH) ETF to the United States Oil (NYSE:USO) ETF. There are 4 things to note on this chart that suggest that if history repeats it is time to look to the Services.

The first is the price line itself. The ratio has dropped 16% over the last month. This could certainly steamroll into more downside but that is a big move in a short time. Second, that move in the ratio has brought it under the 200 day SMA. You can see that over the last 3 years of data on this chart that the ratio has not stayed below the 200 day SMA for very long. In fact when it has been this far below the ratio has reversed and ran higher.
The next thing to notice is momentum. The RSI at the top of the chart has moved into oversold territory. Each time it has touched this level has coincided with a bottom in price and reversal. The MACD has spiked down negative as well. This has also been a bottom signal when it turns.
These indications alone do not warrant a shift from oil to the Oil Servicers. They need confirmation form the price. Should it reverse back over the 200 day SMA it would be a better place to start to shift asset allocation.
DISCLAIMER: The information in this blog post represents my own opinions and does not contain a recommendation for any particular security or investment. I or my affiliates may hold positions or other interests in securities mentioned in the Blog, please see my Disclaimer page for my full disclaimer.
