Let’s talk about Gold and how I am approaching it this October. There are 2 broad themes that I will seek to consider in my analysis. The first being seasonality and how it affects the price of gold. The second is technical analysis. Basically, all things considered, I am bearish on the precious metal.
Seasonality
Gold commentators have often drawn our attention to the September seasonality of Gold, i.e. gold prices are, on average, higher in September. Before I get further in-depth about that, I want to go through the demand aspect of gold so that you can understand my proposed reasoning behind the seasonality of gold.
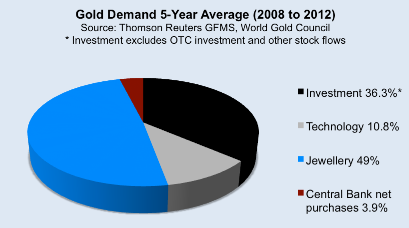
The price of a commodity is influenced by its demand, so let’s take a look at it below:

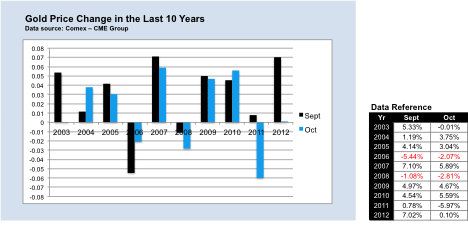
These figures show that the demand for Gold as an example of luxury goods is very high and one must take that into consideration. Now, take a look at the hard numbers for the price change in gold below: 
September has historically been an “up” month 80% of the time, while October was up 60% of the time (with Oct ’03 registering -0.01%). If you are as curious as I am, you will be wondering what the reason could be for this phenomenon. Well, I think that China and India contribute strongly to this demand. India has a wedding season in October followed by Diwali (festival of lights), their biggest holiday. Both these events increase the demand for the shiny metal. As for China, with the Chinese New Year coming in January, and gold as their symbol of luck and prosperity, the demand for gold as gifts would increase.
Technical Analysis
Turning to the technicals, I will start off with 3 descriptive statements of the Weekly charts before I posit some normative conclusions. XAU/USD Weekly Chart" title="XAU/USD Weekly Chart" src="https://d1-invdn-com.akamaized.net/content/pic681c4a4aafb184893554b1f96c550ba4.png" height="377" width="941">
1. Price is below the 200-day Moving Average
2. A Fib retracement drawn from the swing low of Oct 2008 and swing high of Sept 2011 shows the price hovering over the 50 fib level at about $1,300
3. More recently, I observed a swing low in June this year followed by a higher low indicating possible bullish momentum.
I am currently out of the market for Gold but am looking for signals. Price being below the 200-day Moving Average mathematically indicates to me bearish pressure. Trend traders will be looking for opportunities to go short. I have detected a lot of price action within the $1,300 zone (which has confluence with the 50 fib level) and this is of interest to me, as how price moves from this zone will determine a trading opportunity for me.
With today’s price action threatening the higher low and piercing through the 50 fib level, I would observe this very carefully in the upcoming weeks to see if a lower low and lower high fors on the weekly charts for a potential short.
In the mid-term, a higher low has formed but I will not be mid-term bullish till a 2nd higher low is formed. Furthermore, a head and shoulders pattern with a neckline on the $1,300 zone has formed on the daily chart, which makes it a dangerous long. Take a look at the chart below:
XAU/USD Daily" title="XAU/USD Daily" src="https://d1-invdn-com.akamaized.net/content/picba92267686d44ae0c80885918257a720.png" height="377" width="941">
For those mid-term traders out there that want to trade the daily charts instead of the weekly, this pattern supports my bearish view and there could be an opportunity to go short when this pattern confirms itself.
Reconciling Seasonality with Technical Outlook
Seasonality tells us that most of the time, September and October are bullish months. This is no doubt an important factor, but we cannot ignore the fact that prior to 2011/2012, Gold has been on a solid uptrend except for the brief correction in 2008. I, therefore, will have to pay tribute to the fact that for the first time in almost 13 years, Gold is below its 200-day Moving Average. Any bullish bias derived from seasonality has to be put in check as there is a divergence with the technicals. Having said that, if price in the coming weeks fail to form a lower low on the weekly and push through the 200-day Moving Average, I will not rule out the possibility of a convergence and consequently a more bullish bias.
by Jonathan Suen
- English (UK)
- English (India)
- English (Canada)
- English (Australia)
- English (South Africa)
- English (Philippines)
- English (Nigeria)
- Deutsch
- Español (España)
- Español (México)
- Français
- Italiano
- Nederlands
- Português (Portugal)
- Polski
- Português (Brasil)
- Русский
- Türkçe
- العربية
- Ελληνικά
- Svenska
- Suomi
- עברית
- 日本語
- 한국어
- 简体中文
- 繁體中文
- Bahasa Indonesia
- Bahasa Melayu
- ไทย
- Tiếng Việt
- हिंदी
Time to Short Gold?
Published 10/02/2013, 07:53 PM
Updated 05/14/2017, 06:45 AM
Time to Short Gold?
Latest comments
Loading next article…
Install Our App
Risk Disclosure: Trading in financial instruments and/or cryptocurrencies involves high risks including the risk of losing some, or all, of your investment amount, and may not be suitable for all investors. Prices of cryptocurrencies are extremely volatile and may be affected by external factors such as financial, regulatory or political events. Trading on margin increases the financial risks.
Before deciding to trade in financial instrument or cryptocurrencies you should be fully informed of the risks and costs associated with trading the financial markets, carefully consider your investment objectives, level of experience, and risk appetite, and seek professional advice where needed.
Fusion Media would like to remind you that the data contained in this website is not necessarily real-time nor accurate. The data and prices on the website are not necessarily provided by any market or exchange, but may be provided by market makers, and so prices may not be accurate and may differ from the actual price at any given market, meaning prices are indicative and not appropriate for trading purposes. Fusion Media and any provider of the data contained in this website will not accept liability for any loss or damage as a result of your trading, or your reliance on the information contained within this website.
It is prohibited to use, store, reproduce, display, modify, transmit or distribute the data contained in this website without the explicit prior written permission of Fusion Media and/or the data provider. All intellectual property rights are reserved by the providers and/or the exchange providing the data contained in this website.
Fusion Media may be compensated by the advertisers that appear on the website, based on your interaction with the advertisements or advertisers.
© 2007-2025 - Fusion Media Limited. All Rights Reserved.
