Social media platform Twitter (NYSE:TWTR) stock has been in the center of much controversy fending off the scrutiny of the U.S. Congress along with peers Facebook (NASDAQ:FB) and Google (NASDAQ:GOOGL) regarding censorship, data privacy and liability concerns.
While the threat of government legislation looms, the Company has evolved in its monetization and stickiness. Like most social media stocks, Twitter was seen as a pandemic winner, with fears of tailing off due to COVID vaccinations as money flowed away from growth into value stocks on the re-opening trade. The market may be underestimating the stickiness of social platforms especially when mobility makes them even more sticky. Prudent investors seeking to gain exposure on a premiere social media play can monitor opportunistic pullback levels on shares of Twitter.
Q4 FY 2020 Earnings Release
On Feb. 9, 2021, Twitter released its fiscal fourth-quarter 2020 results for the quarter ending December 2020. The Company reported an adjusted earnings-per-share (EPS) profit of $0.38 excluding non-recurring items versus consensus analyst estimates for a profit of $0.31, beating estimates by $0.07. Revenues grew 28.1% year-over-year (YOY) to $1.29 billion beating analyst estimates for $1.19 billion. Advertising revenues rose 31% YoY to $1.15 billion. Data licensing and other revenues rose 9% YoY to $134 million. Monetizable daily active users (mDAU) rose to 192 million, compared to 152 million YoY.
Flat Guidance
Twitter provided a flat Q1 2021 forecast for revenues between $940 million to $1.04 billion versus $964.61 consensus analyst estimates, with operating income in a range between (-$50 million) loss to breakeven. For full-year 2021, the Company expected capex between $900 million to $950 million. The Company plans to grow headcount by more than 20% leading to expenses to rise at least 25%, which includes the buildout of a new data center in 2021.
Virtual Analyst Day
On Feb. 25, 2021, Twitter provided a long-term roadmap in its virtual investor day. They committed to double the velocity of development by 2023. The Company plans to grow mDAU to 315 million users in Q4 2023, representing 20% YoY growth. Twitter expects to “at least” double total annual revenues from $3.7 billion in 2020 to $7.5 billion in revenues in 2023, compared to consensus estimates of $6.45 billion. The Company expects long-term GAAP operating margins to reach mid-teens and adjust EBITDA margin in the 40% to 45% range.
Subscription Models Speculation
The focus on monetization has analysts bullish on the strategic direction of Twitter. Speculation of a premium subscription model would be the ultimate revenue driver but losing engagements is always something that has to be tempered. Twitter is exploring subscription offerings under pressure from activists. Some of the speculation range from charging fees for Tweetdeck, advanced featured like “undo send”, tipping, and profile optimization. Offering premium versions of Topics, Fleets and Spaces, as well as ad-free content, are other potential subscription features. On Mar. 29, 2021, Truist upgraded shares of Twitter to a Buy from Hold with a $74 price target citing double-digit mDAU growth and increased traction with advertisers, raising revenue forecasts from 20% to 25% CAGR through 2023. Twitter may have also low balled guidance playing it safe setting the bar low.

TWTR Opportunistic Pullback Levels
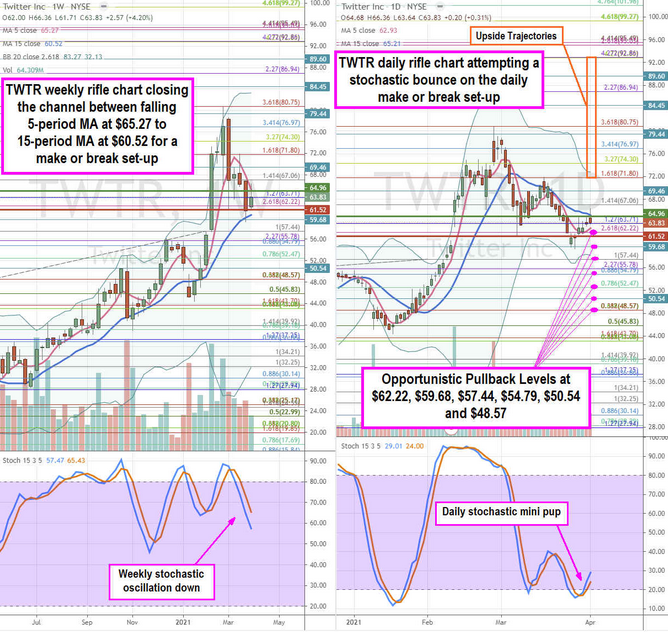
Using the rifle charts on the weekly and daily time frames provides a precision playing field view of the landscape for TWTR stock. The weekly rifle chart uptrend peaked at the $80.75 Fibonacci (fib) level. Shares retreated rapidly with the Nasdaq sell-off overshooting the weekly 5-period moving average (MA) support at $65.27 as it tries to form a channel tightening towards the 15-period MA at $60.52. The weekly has a make or break set-up, which can turn into either a downtrend or a mini inverse pup. The daily rifle chart downtrend is trying to stall out as the 5-period MA at $62.93 rises as a support powered by the stochastic mini pup. The daily market structure low (MSL) triggers above $64.96 then faces the weekly 5-period MA at $65.27. The daily make or break also threatens a market structure high (MSH) sell trigger on a breakdown of $61.52. Prudent investors can monitor for opportunistic pullbacks at the $62.22 fib, $59.68 fib, $57.44 fib, $52.47 fib, $50.54 sticky 5s, and the $48.57 fib. Be sure to watch together with social media stock peers PINS and FB. Upside trajectories range from the $71.80 fib up towards the $92.86 fib level.
