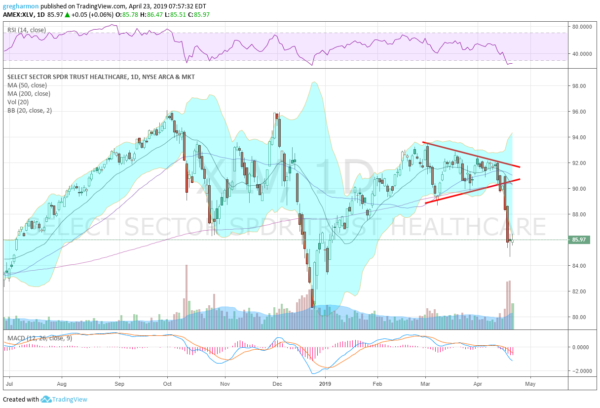
Healthcare stocks made a top in October and then dropped back as the broad market fell. They recovered and were back at their highs at the beginning of December but then had a much worse drop to a Boxing Day low. They recovered like the broad market but stalled out in February.
After two months of sideways price action, while the rest of the market was continuing higher, healthcare stocks took a turn for the worse. They dropped again last week, finding support for now just under the October lows. Why are healthcare stocks dropping like they have the flu when the rest of the market is flying?

Pundits can give you the answer to that question, right or wrong. I do not know for sure. But when I look at the chart of the price action I do see the potential for at least a near term bounce if not more. Since the breakdown out of the symmetrical triangle last week, the healthcare sector ETF has moved down to the pattern target.
The past two days it has held there, churning through volume. The last time it spewed this much volume was near the December low, and then the October initial drop before that. Those dates had something else in common. Both had the RSI drop into oversold territory and then the recovery began. Both also saw the MACD go negative. The current MACD is at the October low, with the December low further negative.
Healthcare stocks may break this short pause and continue lower. But the group has held through a lot of volume the past few days and is sitting at momentum levels where reversals have occurred in the past. Time to watch for the possibility of another one.
The information in this blog post represents my own opinions and does not contain a recommendation for any particular security or investment. I or my affiliates may hold positions or other interests in securities mentioned in the Blog, please see my Disclaimer page for my full disclaimer.
