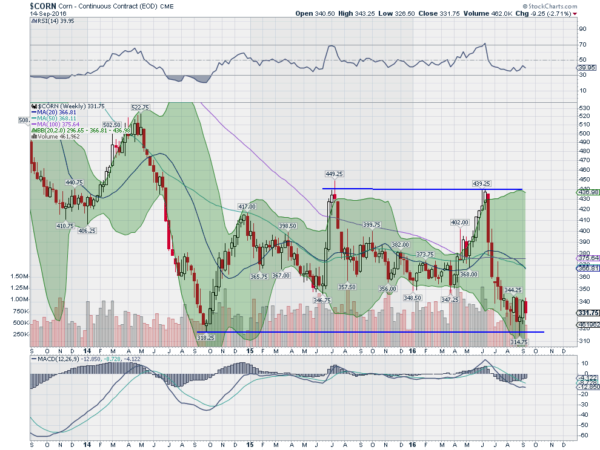
Corn is a staple of the US economy. Here in the Midwest the debate every year is between how much corn to plant and how much soybeans. That decision was many months ago. Now farmers are sitting back and harvesting their crops. Hopefully the farmers sold their corn in May, when it was at a high. Because now it has fallen back to the bottom of a range.
The chart below shows that corn has moved in a broad range between about 320 and 440 for over 2 years. So what do you do when the price of corn is at the bottom of the range? Why you go buy a few bushels, of course. The chart below paints the picture.

The price has spent most of the last two years in the middle of the range. And what happens when it moves to the extremes? It reverts to the middle of the range. Will it happen again? With the price at the bottom of the range it is a good reward to risk ratio to find out.
Additionally Monday printed a Hammer reversal candle that was confirmed Tuesday with a higher close. A move over 345 would give a lot more confidence. Watch for that to participate to the upside.
Disclaimer: The information in this blog post represents my own opinions and does not contain a recommendation for any particular security or investment. I or my affiliates may hold positions or other interests in securities mentioned in the Blog, please see my Disclaimer page for my full disclaimer.
