Banks come in all shapes and sizes. The one above is certainly one of the more unusual one’s though. Through my career I have worked for a few banks. And I can say that they also have all sorts of shapes and sizes of offices within the same bank. Take JP Morgan for example. When I first started there (it was Chase Manhattan then) I worked 4 floors underground at 1 Chase Plaza, later on the 14th floor on Park Avenue and 51st, then back to the 3rd floor of the basement before I left. They can show you whatever they want to show you.
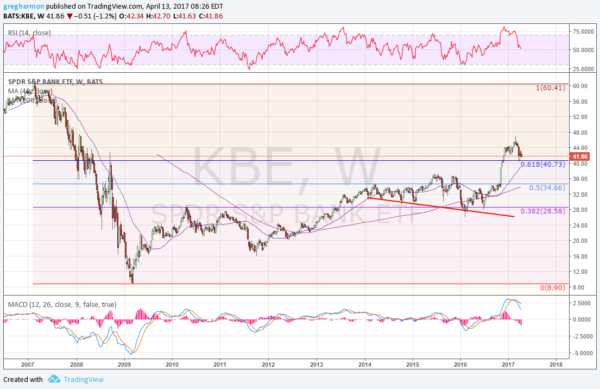
That goes for bank earnings as well. And today they shine for the most part with JPMorgan (NYSE:JPM), Citigroup (NYSE:C) and Wells Fargo (NYSE:WFC) posting better than expected EPS. Like I said, they can show you whatever they want to show you. So when I look at the banks I look at the reaction, the sentiment, all contained in the price action to tell me what is happening. A broader look at that comes from the S&P Bank ETF (NYSE:KBE). The chart below tells a story, without the noise and glossy facade of a nice earnings report.

The chart above shows the ETF from its all-time high in early 2007 until today on a weekly basis. Yes, there is an index that has not made a new all-time high. After a bounce at the bottom of the financial crisis in 2009 to a short term peak in 2010 at a 38.2% retracement of the fall, it floundered for several years. When the 200 week SMA finally came to meet the price, it started higher in August 2012, pushing to a new high and stalling at the 50% retracement of the fall. From mid 2013 until the election last fall it basically moved sideways in consolidation. That is a long consolidation.
It jumped after the election racing higher to a top at the end of February. A shooting star candlestick was a portend for a reversal and it has delivered that reversal since, falling back to the 61.8% retracement of the big drop. That pullback did a good job of resetting momentum indicators lower. The RSI fell from being overbought to now at the mid line near the edge of the bullish zone. And the MACD has also crossed down and moved lower. It is nearly back to its 200 day (40 week) SMA and at a crossroads.
Technically, this would be a great place for the ETF to bounce, and with strong earnings reports that could be the course. But a retracement back the prior consolidation zone would also keep the longer view bullish. A cross down through that 50% level would turn the tide to bearish for the banks. Which path will it take? I do not know. Prepare for all 3.
The information in this blog post represents my own opinions and does not contain a recommendation for any particular security or investment. I or my affiliates may hold positions or other interests in securities mentioned in the Blog, please see my Disclaimer page for my full disclaimer.
