Investing.com’s stocks of the week
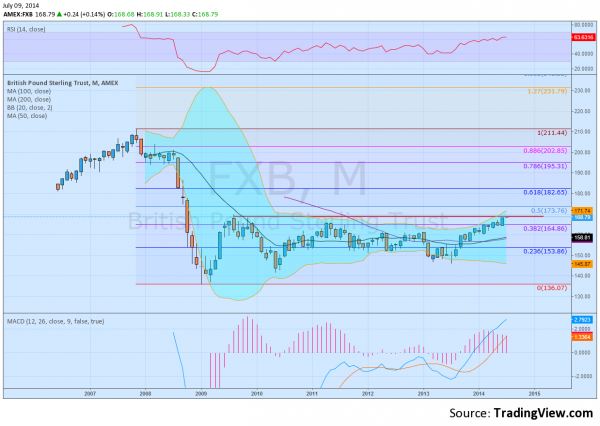
The currency pair US Dollar vs Pound Sterling (USD/GBP) got its nickname, Cable, in the old days of trading when the only way to trade it was via a cable under the Atlantic. Cool story. Check it out if you are young to see if I am telling the truth. But if you are just interested in trading it and making money then you can look for yourself. The monthly chart of the ETF for the pair, FXB, highlights 2 distinct features. First, the devaluation from 211 to 136, and the second, the 5 year consolidation between roughly 155 and 165. It is this second feature that is signaling a possible long term trade opportunity. The price is moving through the prior high from August 2009 with support for a continued upward move from 3 indicators. The momentum indicators, RSI and MACD are both bullish and rising.

The Bollinger bands are opening to the upside as well. A fourth may be the moving averages starting to turn up. With the 5 year consolidation between two technical levels, the 23.6% and 38.2% retracement of the downward move it has been considered a weak bounce. But a move higher now would target the 61.8% Fibonacci level at 182.65 or higher. Are you ready for a Cable trade?
Disclosure: The information in this blog post represents my own opinions and does not contain a recommendation for any particular security or investment. I or my affiliates may hold positions or other interests in securities mentioned in the Blog, please see my Disclaimer page for my full disclaimer.
