Tiffany & Co. (TIF) is a holding company and conducts all business through its subsidiary companies. The Company, through its subsidiaries, including Tiffany and Company (Tiffany), sells fine jewelry and other items that it manufactures or has been made by others.
This is another vol note -- depressed vol to be more specific, but in a stock that has recently had a sharp move down.
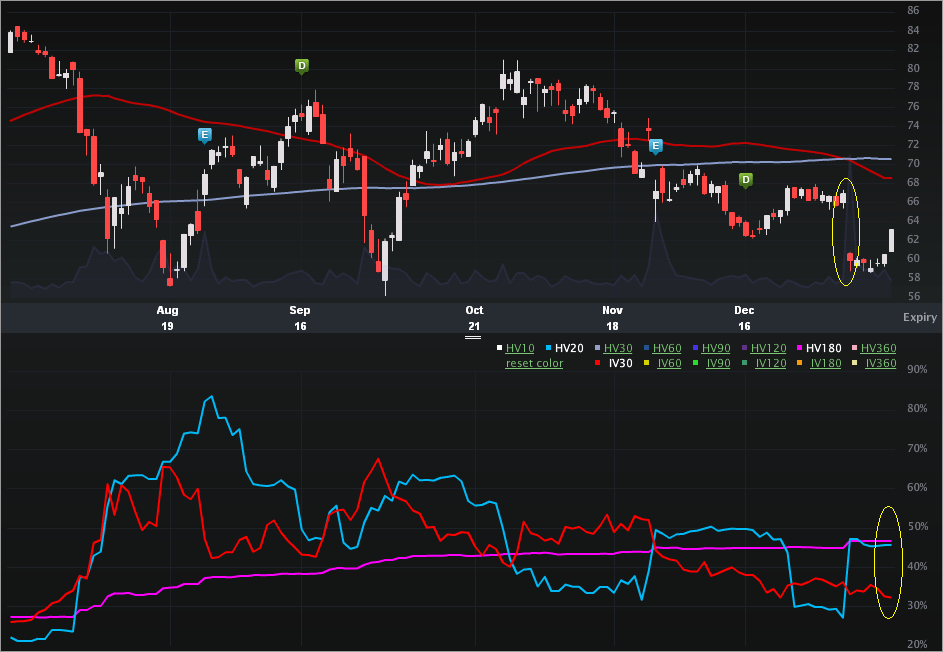
Let's start with the Charts Tab (6 months), below. The top portion is the stock price, the bottom is the vol (IV30™ - red vs HV20 - blue vs HV180 - pink).
In the stock portion I've highlighted the gap down on 1-9-2012 from $66.94 down to 59.94 or 10.5%. The news that preceded that move was lowered earnings guidance. Here's a snippet from a news story:
"Jewelry retailer Tiffany & Co. said Tuesday that its sales growth weakened in the U.S. as shoppers pulled back on buying pricey baubles during the key holiday season.
The company known for its iconic turquoise box cut its yearly earnings guidance. Its shares fell more than 10 percent in morning trading."
Source: Associated Press via Yahoo! Finance -- Tiffany's US holiday sales growth weakens
On the vol side, I've highlighted the current vol comps. The implied is trading below both historical measures. It's important to note that the HV20™ is elevated now because of that stock move and it was 27.29% before the gap in stock. Still the implied is significantly depressed to the longer-term historical realized measure (HV180™) and the HV20™ is actually in line with that longer-term measure. The comps are:
IV30™: 32.37%
HV20™: 45.69%
HV180™: 46.67%
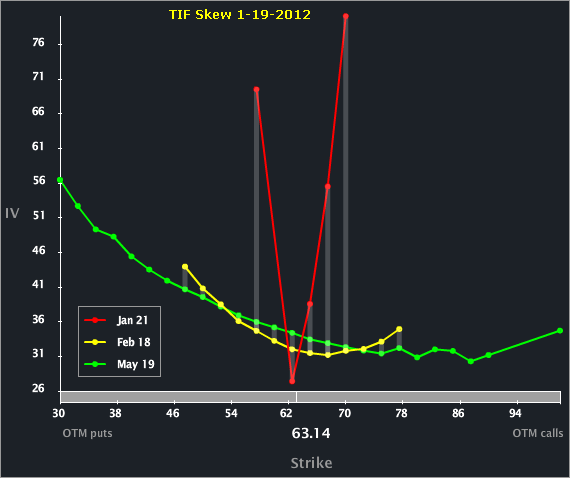
Let's turn to the Skew tab.
The Jan options show stickiness in the OTM calls and puts and thus the weird looking "V" shape. The second and third expiries show a more normal shape, with May elevated to Feb, likely because of an earnings event in late Mar.
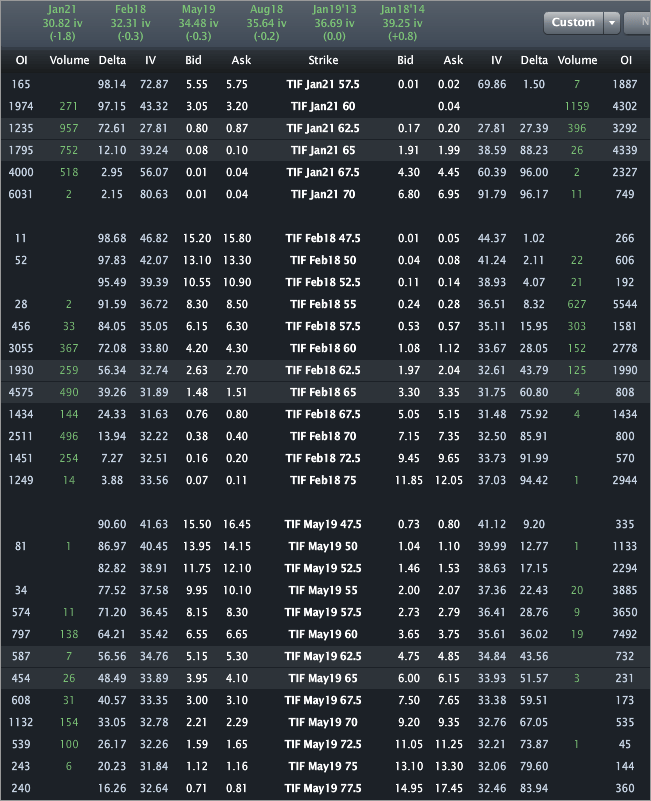
Finally, let's turn to the Options Tab.
We can see that May vol is priced to 34.48% and Feb is priced to 32.31%. Both of those levels are below the HV measures. In English, the option market reflects less risk moving forward (even with an earnings announcement), then the stock has seen both in the last twenty trading days, and in the last 180 trading days. The last two earnings cycles for TIF have seen ~$5.50 moves in stock price in one day.
Possible Trades to Analyze
This is trade analysis, not a recommendation.
- English (UK)
- English (India)
- English (Canada)
- English (Australia)
- English (South Africa)
- English (Philippines)
- English (Nigeria)
- Deutsch
- Español (España)
- Español (México)
- Français
- Italiano
- Nederlands
- Português (Portugal)
- Polski
- Português (Brasil)
- Русский
- Türkçe
- العربية
- Ελληνικά
- Svenska
- Suomi
- עברית
- 日本語
- 한국어
- 简体中文
- 繁體中文
- Bahasa Indonesia
- Bahasa Melayu
- ไทย
- Tiếng Việt
- हिंदी
Tiffany: Depressed Volume After Gap Down on Downward Guidance
Published 01/20/2012, 02:32 AM
Updated 07/09/2023, 06:31 AM
Tiffany: Depressed Volume After Gap Down on Downward Guidance
Latest comments
Loading next article…
Install Our App
Risk Disclosure: Trading in financial instruments and/or cryptocurrencies involves high risks including the risk of losing some, or all, of your investment amount, and may not be suitable for all investors. Prices of cryptocurrencies are extremely volatile and may be affected by external factors such as financial, regulatory or political events. Trading on margin increases the financial risks.
Before deciding to trade in financial instrument or cryptocurrencies you should be fully informed of the risks and costs associated with trading the financial markets, carefully consider your investment objectives, level of experience, and risk appetite, and seek professional advice where needed.
Fusion Media would like to remind you that the data contained in this website is not necessarily real-time nor accurate. The data and prices on the website are not necessarily provided by any market or exchange, but may be provided by market makers, and so prices may not be accurate and may differ from the actual price at any given market, meaning prices are indicative and not appropriate for trading purposes. Fusion Media and any provider of the data contained in this website will not accept liability for any loss or damage as a result of your trading, or your reliance on the information contained within this website.
It is prohibited to use, store, reproduce, display, modify, transmit or distribute the data contained in this website without the explicit prior written permission of Fusion Media and/or the data provider. All intellectual property rights are reserved by the providers and/or the exchange providing the data contained in this website.
Fusion Media may be compensated by the advertisers that appear on the website, based on your interaction with the advertisements or advertisers.
© 2007-2025 - Fusion Media Limited. All Rights Reserved.
