Upcoming US Events for Today:- Weekly Jobless Claims will be released at 8:30am. The market expects Initial Claims to show 312K versus 300K previous.
- Philadelphia Fed Index for April will be released at 10:00am. The market expects 10.0 versus 9.0 previous.
Upcoming International Events for Today:
- German PPI for March will be released at 2:00am EST. The market expects a year-over-year decline of 0.8% versus a decline of 0.9% previous.
- Canadian CPI for March will be released at 8:30am EST. The market expects a year-over-year increase of 1.4% versus an increase of 1.1% previous.
The Markets
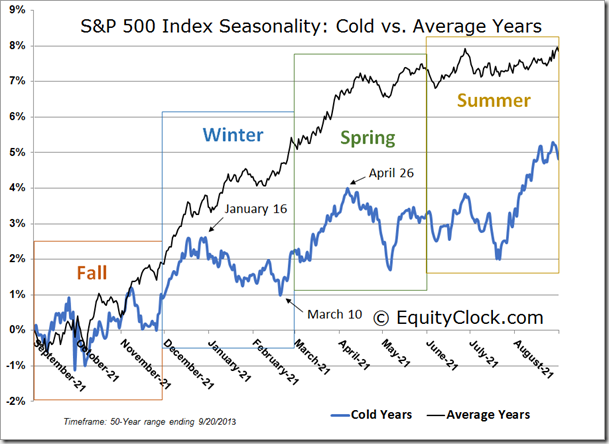
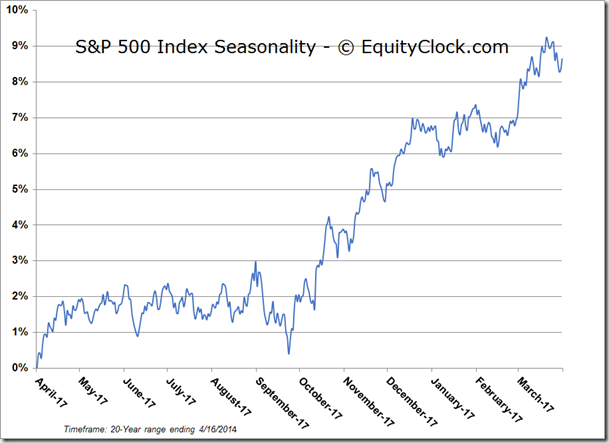
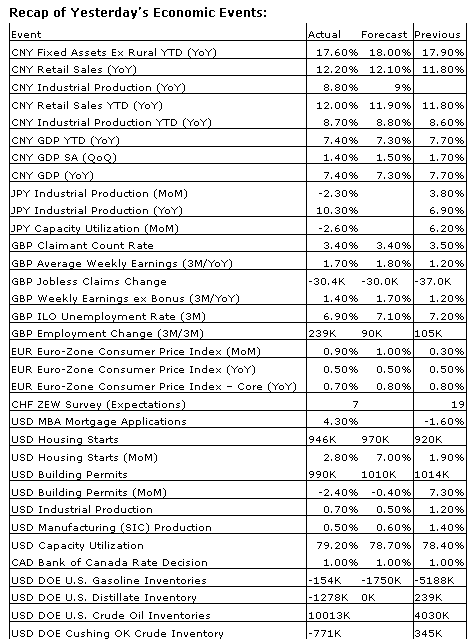
Stocks rose for a third day following better than expected reports pertaining to GDP in China and Industrial Production in the US. Economic data continues to show that the economy is rebounding from the cold and snowy winter with industrial production reporting an increase for March of 0.7%, exceeding estimates calling for an increase of 0.4%. As with the report on retail sales that was released on Monday, February data was also revised higher, in this case reporting an increase of 1.2% for the month versus a previously recorded increase of 0.6%. The better than expected results over the past few days have helped to lift the Citigroup Economic Surprise Index, which records the degree to which reports miss or exceed analyst estimates. The Index has been trending lower for much of the year, thus far, as the weather continues to pose a variable that analysts can’t quite account for. Typically, when this happens, analysts are forced to revise estimates lower, casting a pessimistic cloud over the market; equity valuations typically adjust as well. Although the better than expected reports have caused just a minor impact on the Surprise Index, it could suggest that the indicator is finally turning a corner as economic reports are released that are undistorted by the abnormal winter weather that in many cases brought the economy to a halt. The S&P 500 has managed to mitigate the typical reaction to colder than average winters, trading higher despite the disappointing reports when negative tendencies are the average. The next average peak on the Colder than Average Winter Seasonal Chart is April 26, following which an abrupt decline into a generally flat and volatile summer period can be seen.
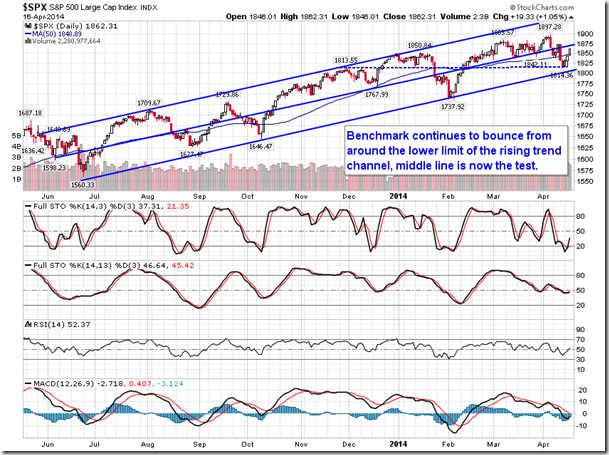
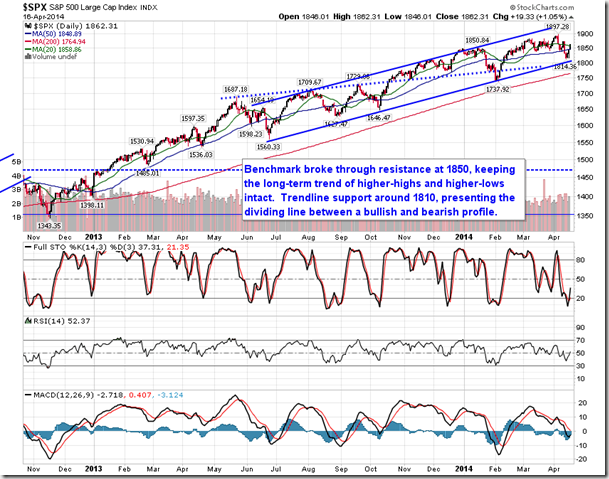
Turning right to the S&P 500, it is apparent that the rebound continues to progress, following the bounce from the lower limit of the rising trend channel; the middle line is now the key test. This center-line is currently trending around 1875.While the benchmark remains in the lower half of the rising trend channel, a weak positive trend can be implied, making equity markets vulnerable should selling pressures re-escalate. Trendline and horizontal support at 1815 remains the line in the sand to maintain the ongoing trend of higher-highs and higher-lows. However, many warning signs and the end to the period of seasonal strength for equity markets provides little confidence that the trend will be maintained beyond the present month. The period of seasonal strength for equity markets concludes on May 5th, on average.
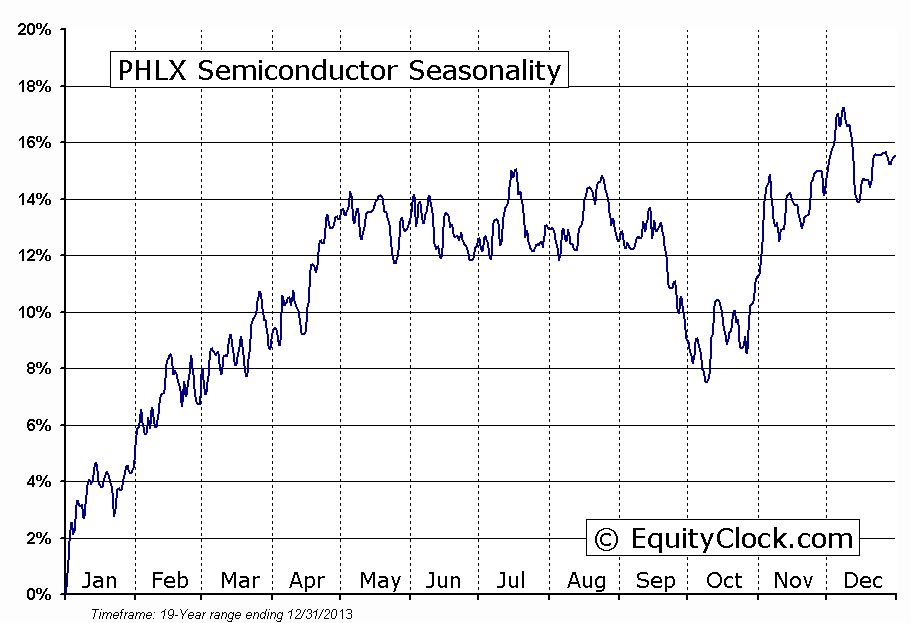
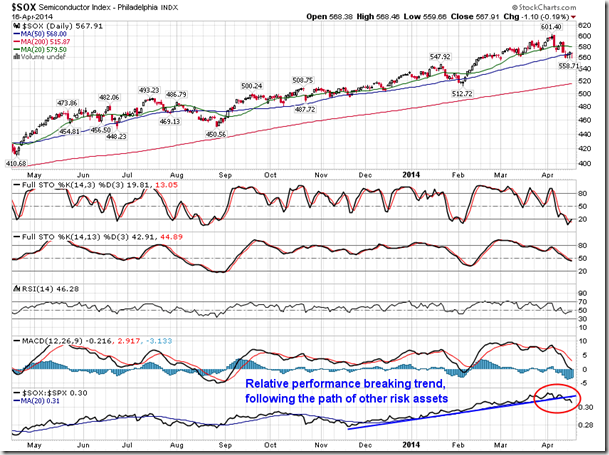
A new warning signal is being provided by the semiconductor industry as underperformance versus the market becomes apparent. Investors will tend to sell their high-beta, often economically sensitive, positions ahead of market peaks into order to protect portfolios from potential volatility ahead. We’ve certainly seen a lot of this already with the selloff in momentum stocks, as well as in the biotechnology industry. Semiconductor stocks, however, held up rather well through the volatility realized in the Nasdaq since the beginning of March. The Semiconductor Industry Index hit the high of the year at the beginning of April and has since pulled back, underperforming the market over the past couple of weeks. This emerging trend may now be confirming the warning signs we’ve been seeing in other cyclical assets as investors prepare for further weakness ahead; the first tranche of risk assets have been sold via a number of momentum names and now the next tranche via industries such as semiconductors may be underway. Seasonal tendencies for semiconductor stocks are flat to negative between May and October.
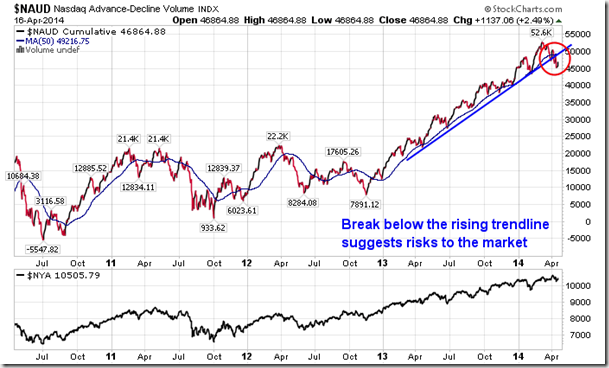
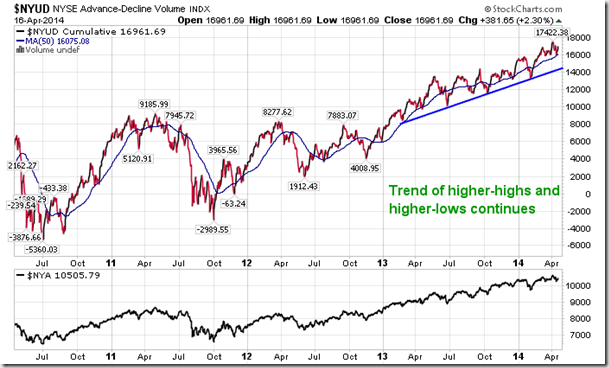
One indicator that remains a positive for the broad equity market is the NYSE Advance-Decline Volume line, which continues to trend higher via higher-highs and higher-lows. This breadth indicator has maintained a positive trend since mid-2012; the 50-day moving average has followed suit, pointing higher over that timeframe. When this indicator breaks trend, it would be expected that significant equity market weakness would follow. Past instances of this were recorded in mid-2011 and mid-2012 where a breakdown in the indicator accompanied significant market weakness during the spring and summer months. The NYSE Advance-Decline Volume line is not at that point yet, however, the Nasdaq Advance-Decline Volume line is already showing a break of trend. Both indicators will be monitored closely to confirm some of the other warning signals that continue to suggest a topping process for equity markets.
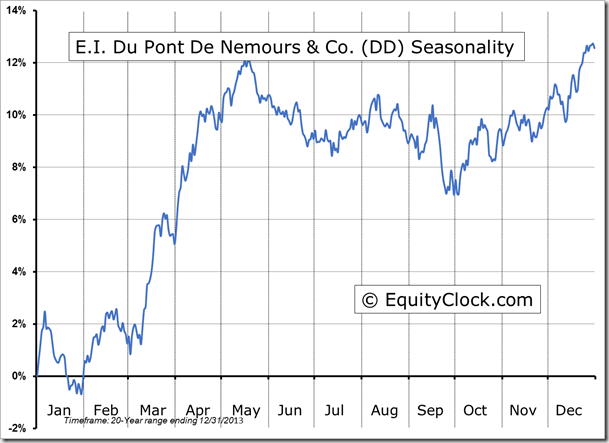
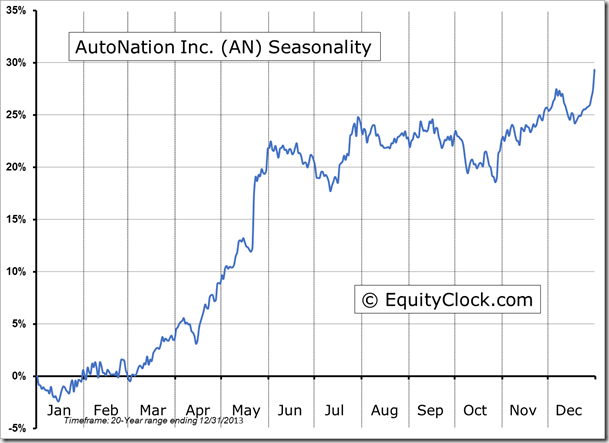
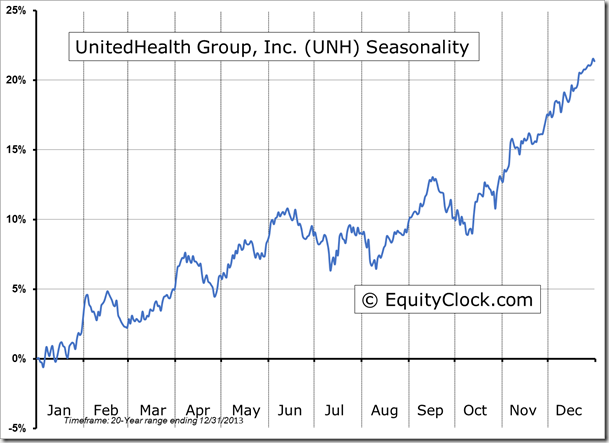
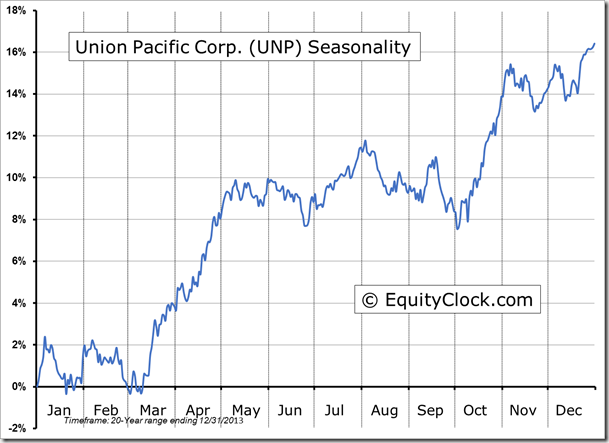
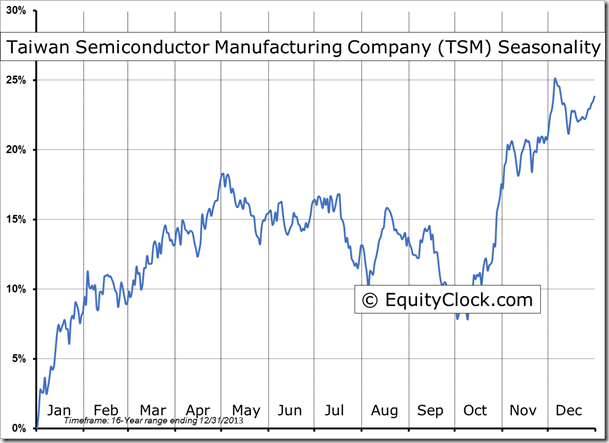
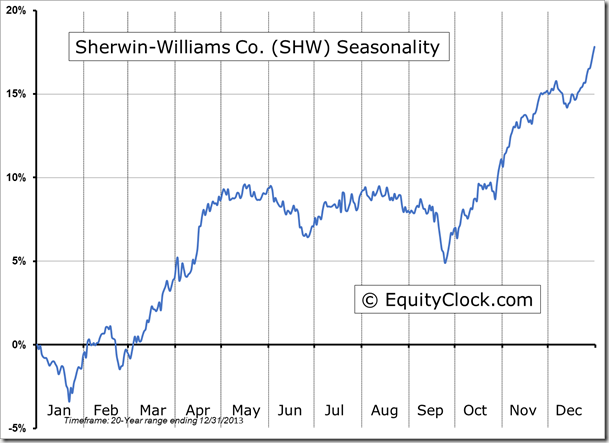
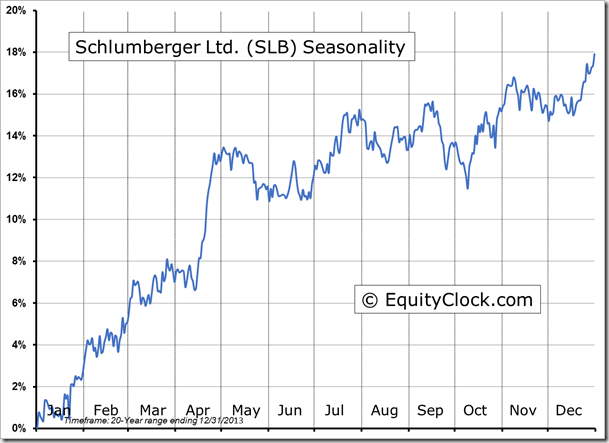
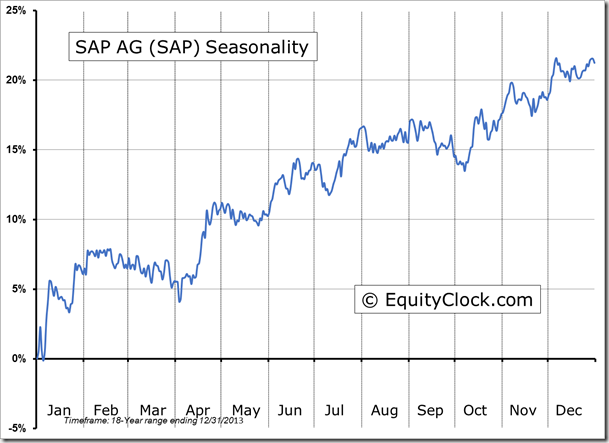
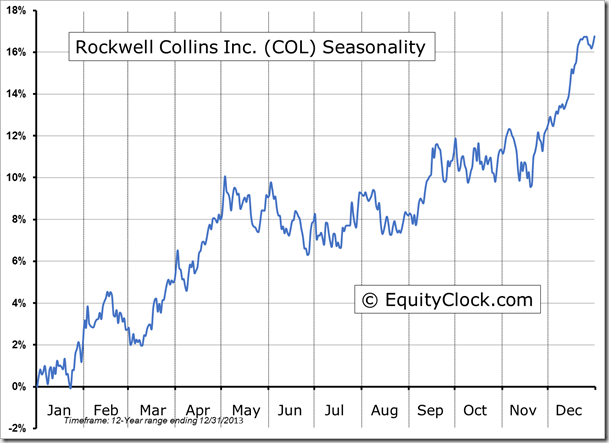
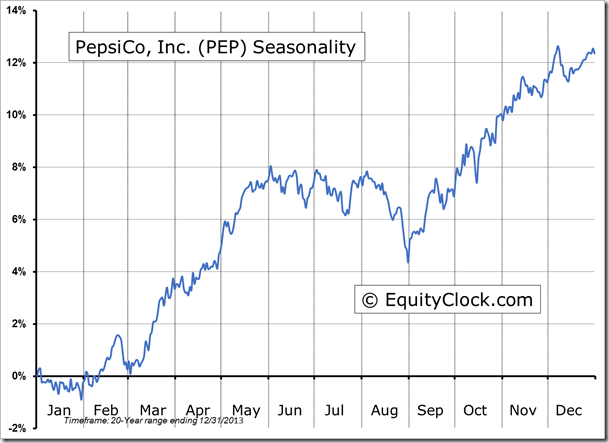
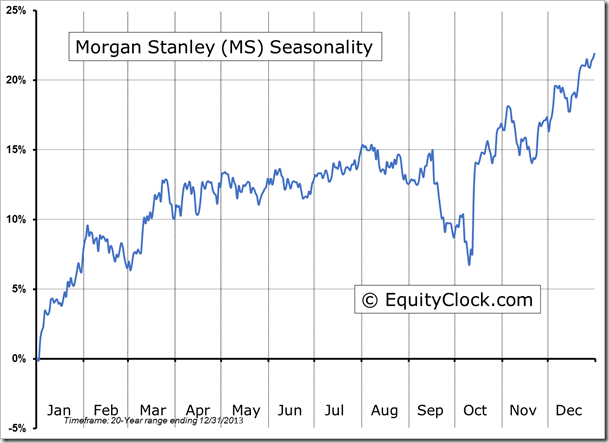
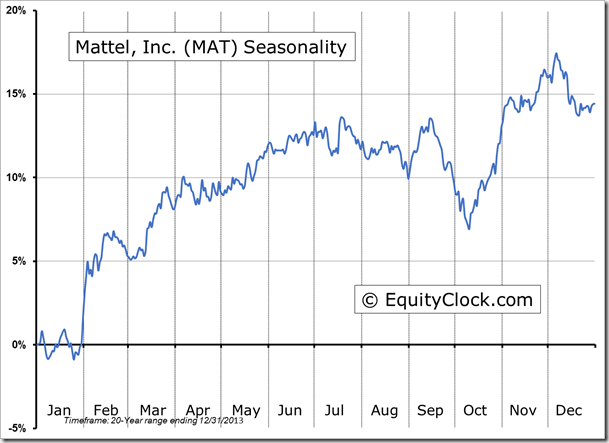
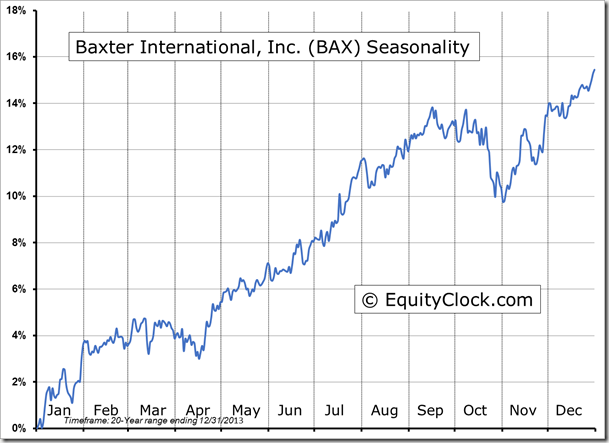
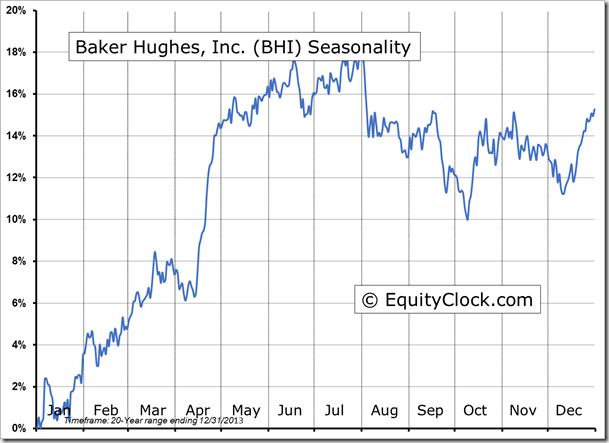
Seasonal charts of companies reporting earnings today:
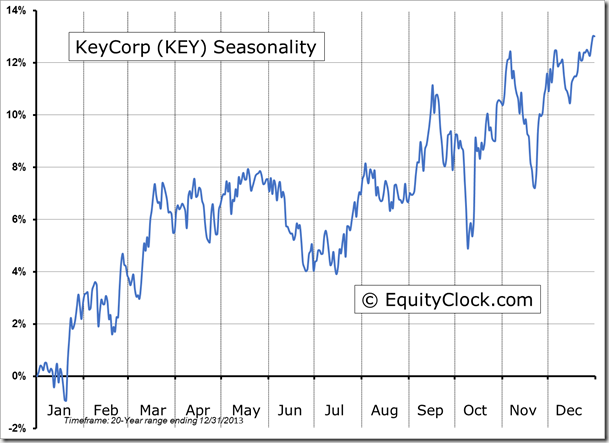
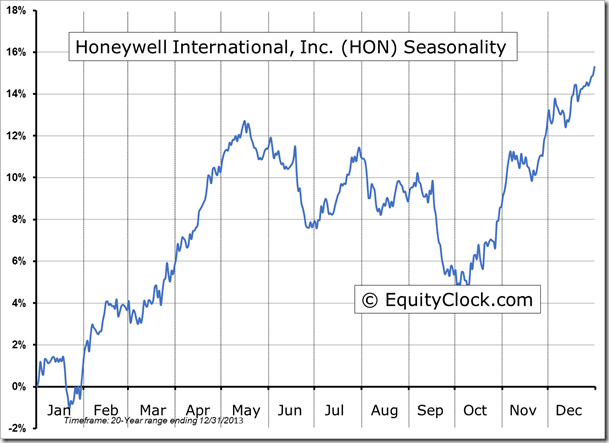
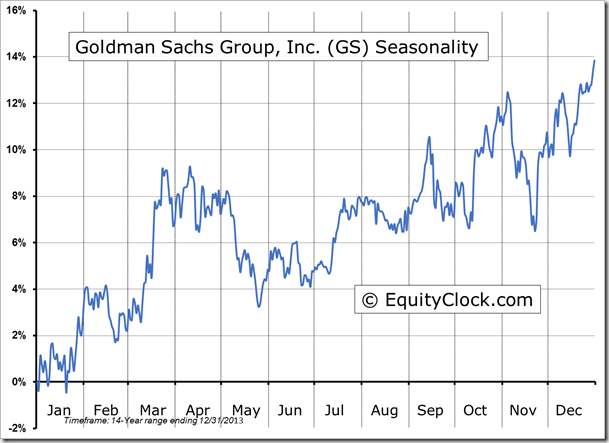
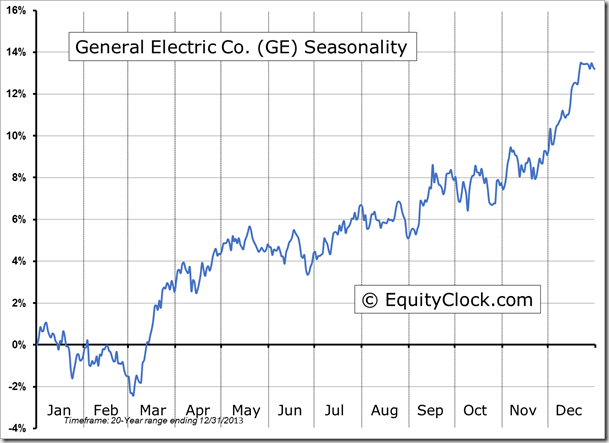
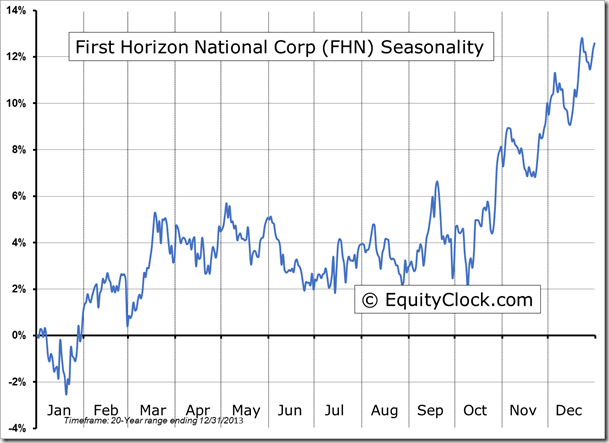
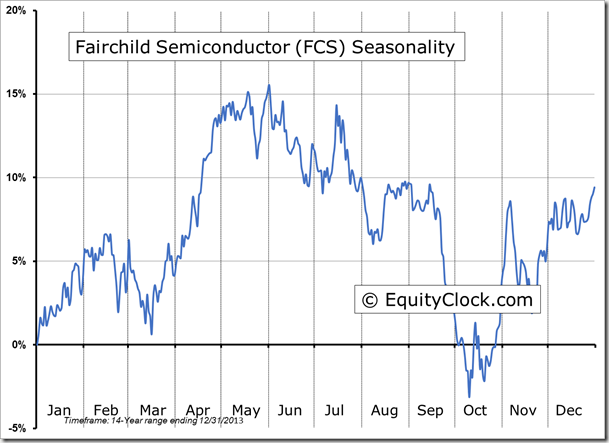
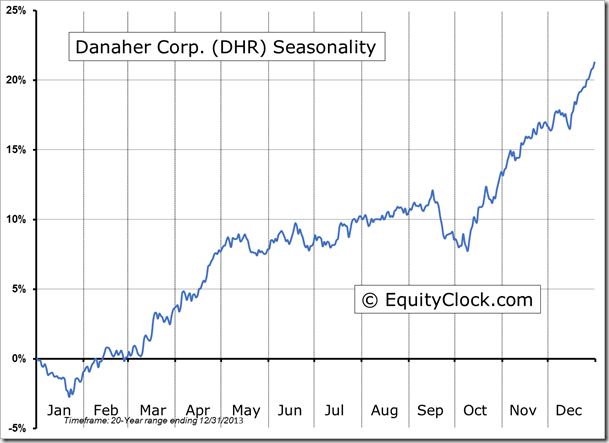
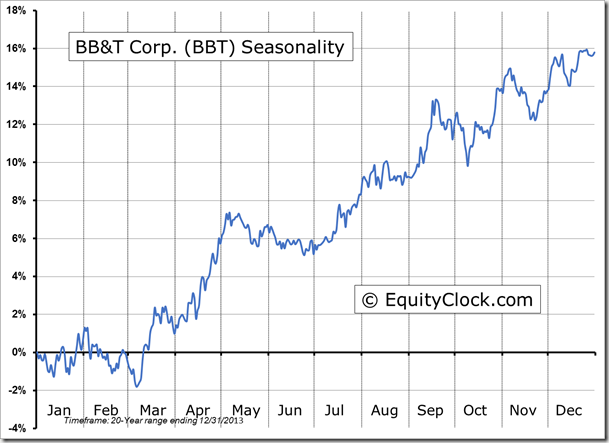
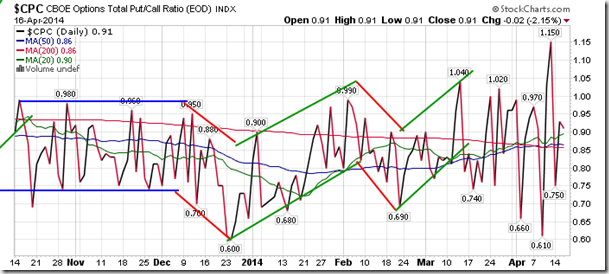
Sentiment on Wednesday, as gauged by the put-call ratio, ended bullish at 0.91.
S&P 500 Index
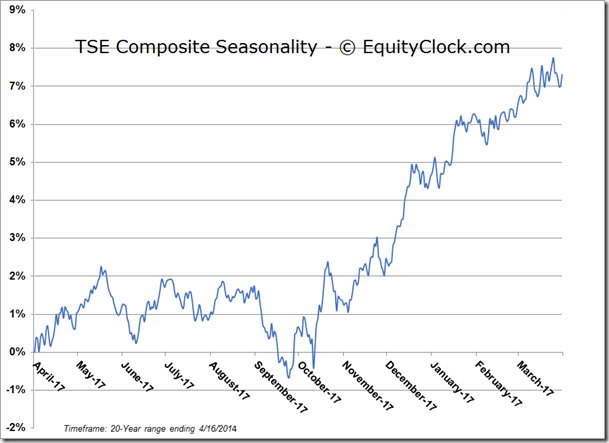
TSE Composite
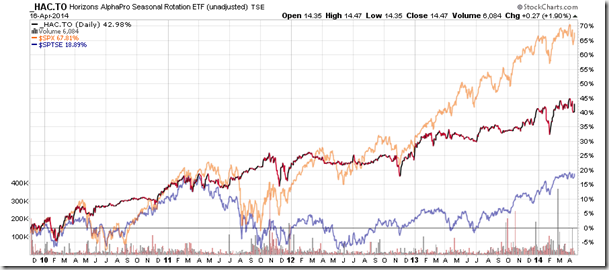
Horizons Seasonal Rotation ETF (HAC.TO)
- Closing Market Value: $14.47 (up 1.90%)
- Closing NAV/Unit: $14.46 (up 0.90%)
Performance*
| 2014 Year-to-Date | Since Inception (Nov 19, 2009) | |
| HAC.TO | 1.12% | 44.6% |
* performance calculated on Closing NAV/Unit as provided by custodian

