The amount of economic data and analysis in cyberspace is overwhelming. One must pre-decide what is important, and not important. Even with automation where human minds do not touch the data – weighting factors or algorithms are used when sifting through the data. With all the data out there, I could make strong cases the economy was recessing, muddling or expanding.
On occasion, some pundits mine the data to prove a point. But the economy is not a single dynamic or grouping of data points but millions of dynamics interacting. While many parts of the economy will be expanding and different rates, it is also true that many will be contracting at different rates.
The governing groups of dynamics are constantly in a state of flux. One must always question if this time is different – and also question if that particular model is correctly forecasting. Using several economic models which have different views of the governing dynamics provides a broad perspective. Generally, all economic models are forecasting economic expansion with the major exception being ECRI’s Weekly Leading Indicator until this week (this index is now positive).
GDP and Consumer Spending
GDP is a rear view economic mirror – and to consider it a forecasting tool is ignorant.
This past week the second estimate of second quarter GDP revised upward economic growth to 1.7% based on more detailed information. Generally, if the second half of a quarter is stronger than the first half – GDP will tend to strengthen with each subsequent estimate and the carry forward to the next quarter is often positive.
GDP is telling us the economy may have been growing more strongly going into the third quarter. GDP is not my favorite tool to understand economic history – as it tells only part of the story of the consumer – namely spending. Yet, while the consumer appears to have hunkered down compared to 1Q2012, the consumer also appears to have been spending more in the second half of the second quarter than the first half.
My theory is the uncertainty on the economy and their jobs going forward has caused the consumer to be more conservative. There is no indication (yet?) of a spending contraction while there are glimpses consumer spending is improving.
And for those who believe we are currently in a recession, one would have to ignore the Personal Consumption Expenditures (PCE) for July 2012 released Thursday. The data shows a strong spending growth in the first month of 3Q2012. It is interesting that the backward revisions have almost removed the contractions originally shown in the PCE data for 2Q2012. It is the backward revisions which make real time analysis of consumer spending literally impossible.
Econintersect Forecast
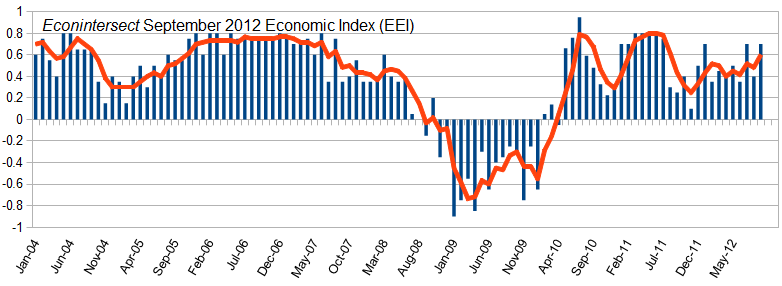
In doing the Econintersect Forecast for September, the Main Street economic drivers appear to be gradually strengthening through 2012 – unfortunately the growth takes a microscope to see, and has been very turbulent (up one month, down the next). I warned when the September forecast was published:
Before you break out the champagne, this is a relative index – it shows that tomorrow will be better than today, but does not quantify the amount of the improvement. It appears the downward trends have at least temporarily abated.
Econintersect Economic Index (EEI) with a 3 Month Moving Average (red line) 
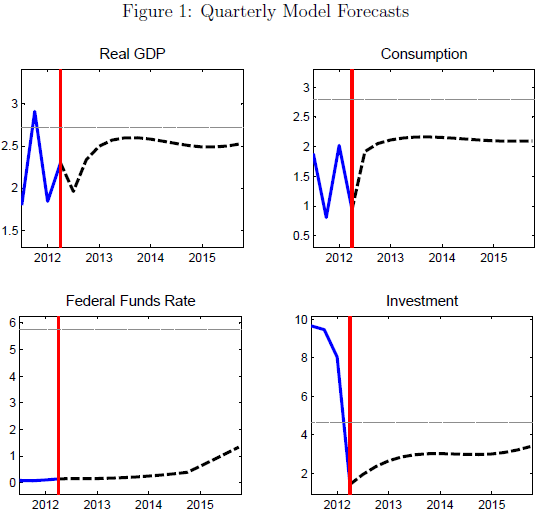
Chicago Fed Economic Model
The Chicago Fed has a dynamic stochastic general equilibrium (DSGE) model is used for policy analysis and forecasting. I bring this up because this model is predicting short term weakness in GDP and the return of the consumer.
My Takeaway
It is very easy (although intellectually lazy) to add up only the negative data, and believe the economy is headed into darkness. However, overall the USA economy appears to be muddling along with a subtle (unnoticeable to some segments) improvement. With all the negative trend lines earlier this year, I was concerned the economy was headed for contraction. It still might, but for now trends are improving.
Other Economic News this Week:
The Econintersect economic forecast for September 2012 shows moderate growth continuing. Overall, trend lines seem to be stable even with the fireworks in Europe, and poor data from China. An emotional component of my mind cannot help thinking this is the calm before the storm. But a logical component in the same cranium sees there are no recession flags showing in any of the indicators Econintersect follows which have been shown to be economically intuitive. There is no whiff of recession in the hard data – even though certain surveys are at recession levels.
ECRI stated in September 2011 a recession was coming, and now says a recession is already underway. The size and depth is unknown. A positive result is this pronouncement has caused much debate in economic cyberspace. I will be glad when ECRI removes this warning (and hopefully not when the economy actually crosses into darkness).
The ECRI WLI growth index value moved this week into positive territory. The index is indicating the economy six month from today will be slightly better than it is today.
Current ECRI WLI Growth Index
Initial unemployment claims rose from 372,000 (reported last week) to 374,000 this week. Historically, claims exceeding 400,000 per week usually occur when employment gains are less than the workforce growth, resulting in an increasing unemployment rate (background here and here). The real gauge – the 4 week moving average – rose slightly from 368,000 (reported last week) to 370,250. Because of the noise (week-to-week movements from abnormal events AND the backward revisions to previous weeks releases), the 4-week average remains the reliable gauge.
Weekly Initial Unemployment Claims – 4 Week Average – Seasonally Adjusted – 2010 (blue line), 2011 (red line), 2012 (green line)
Data released this week which contained economically intuitive components(forward looking) were
- Rail movements (where the economic intuitive components continue to be indicating a moderately expanding economy).
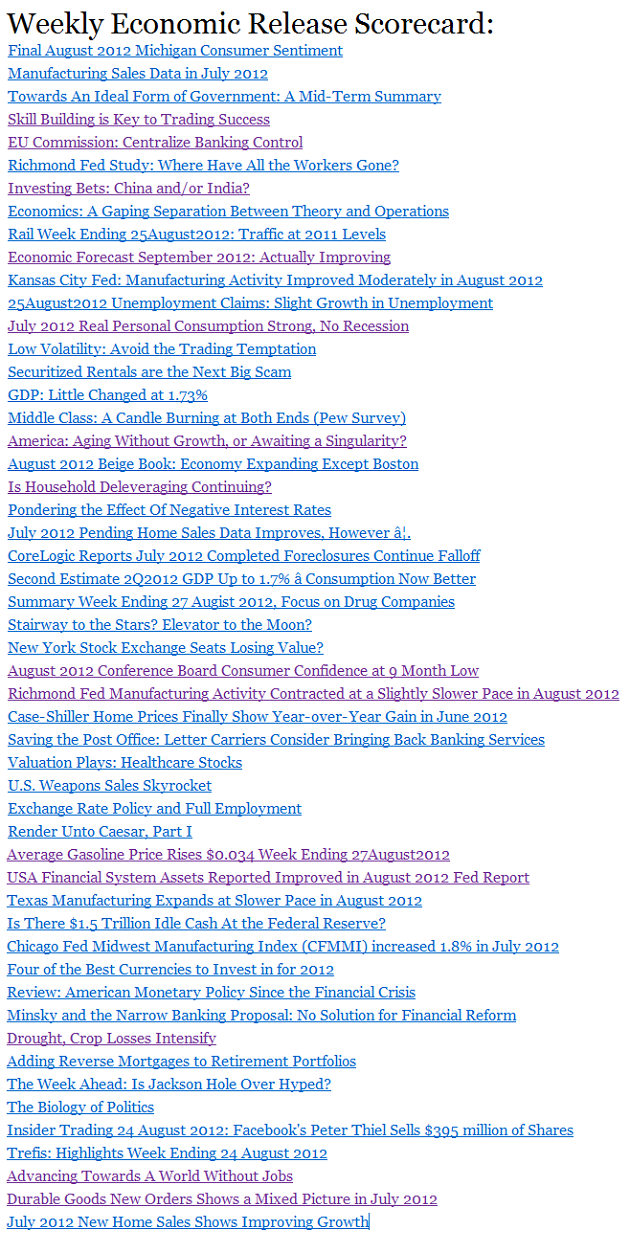
Weekly Economic Release Scorecard:
Click here to view the scorecard table below with active hyperlinks.
 Bankruptcies this Week: Ampal-American Israel, CHL, Contec Holdings