Two hurricanes hit two of the largest US states over the last 5-6 weeks. This had a strong impact on two of this past week’s major releases (retail sales, initial unemployment claims, and industrial production). It will undoubtedly lower 3Q GDP. By how much is, of course, anybody’s guess.
But Federal Reserve Banks are already lowering their respective "nowcasts: The Atlanta Fed’s GDP Nowcast is 2.2% while on Friday, the NY Fed sharply lowered its 3Q projection to 1.3%. Despite the situational weakness in two coincident indicators, the markets hit all-time highs this past week. But as with all recent advancements, we should be cautious about over-interpreting the potential bullishness we read into this move.
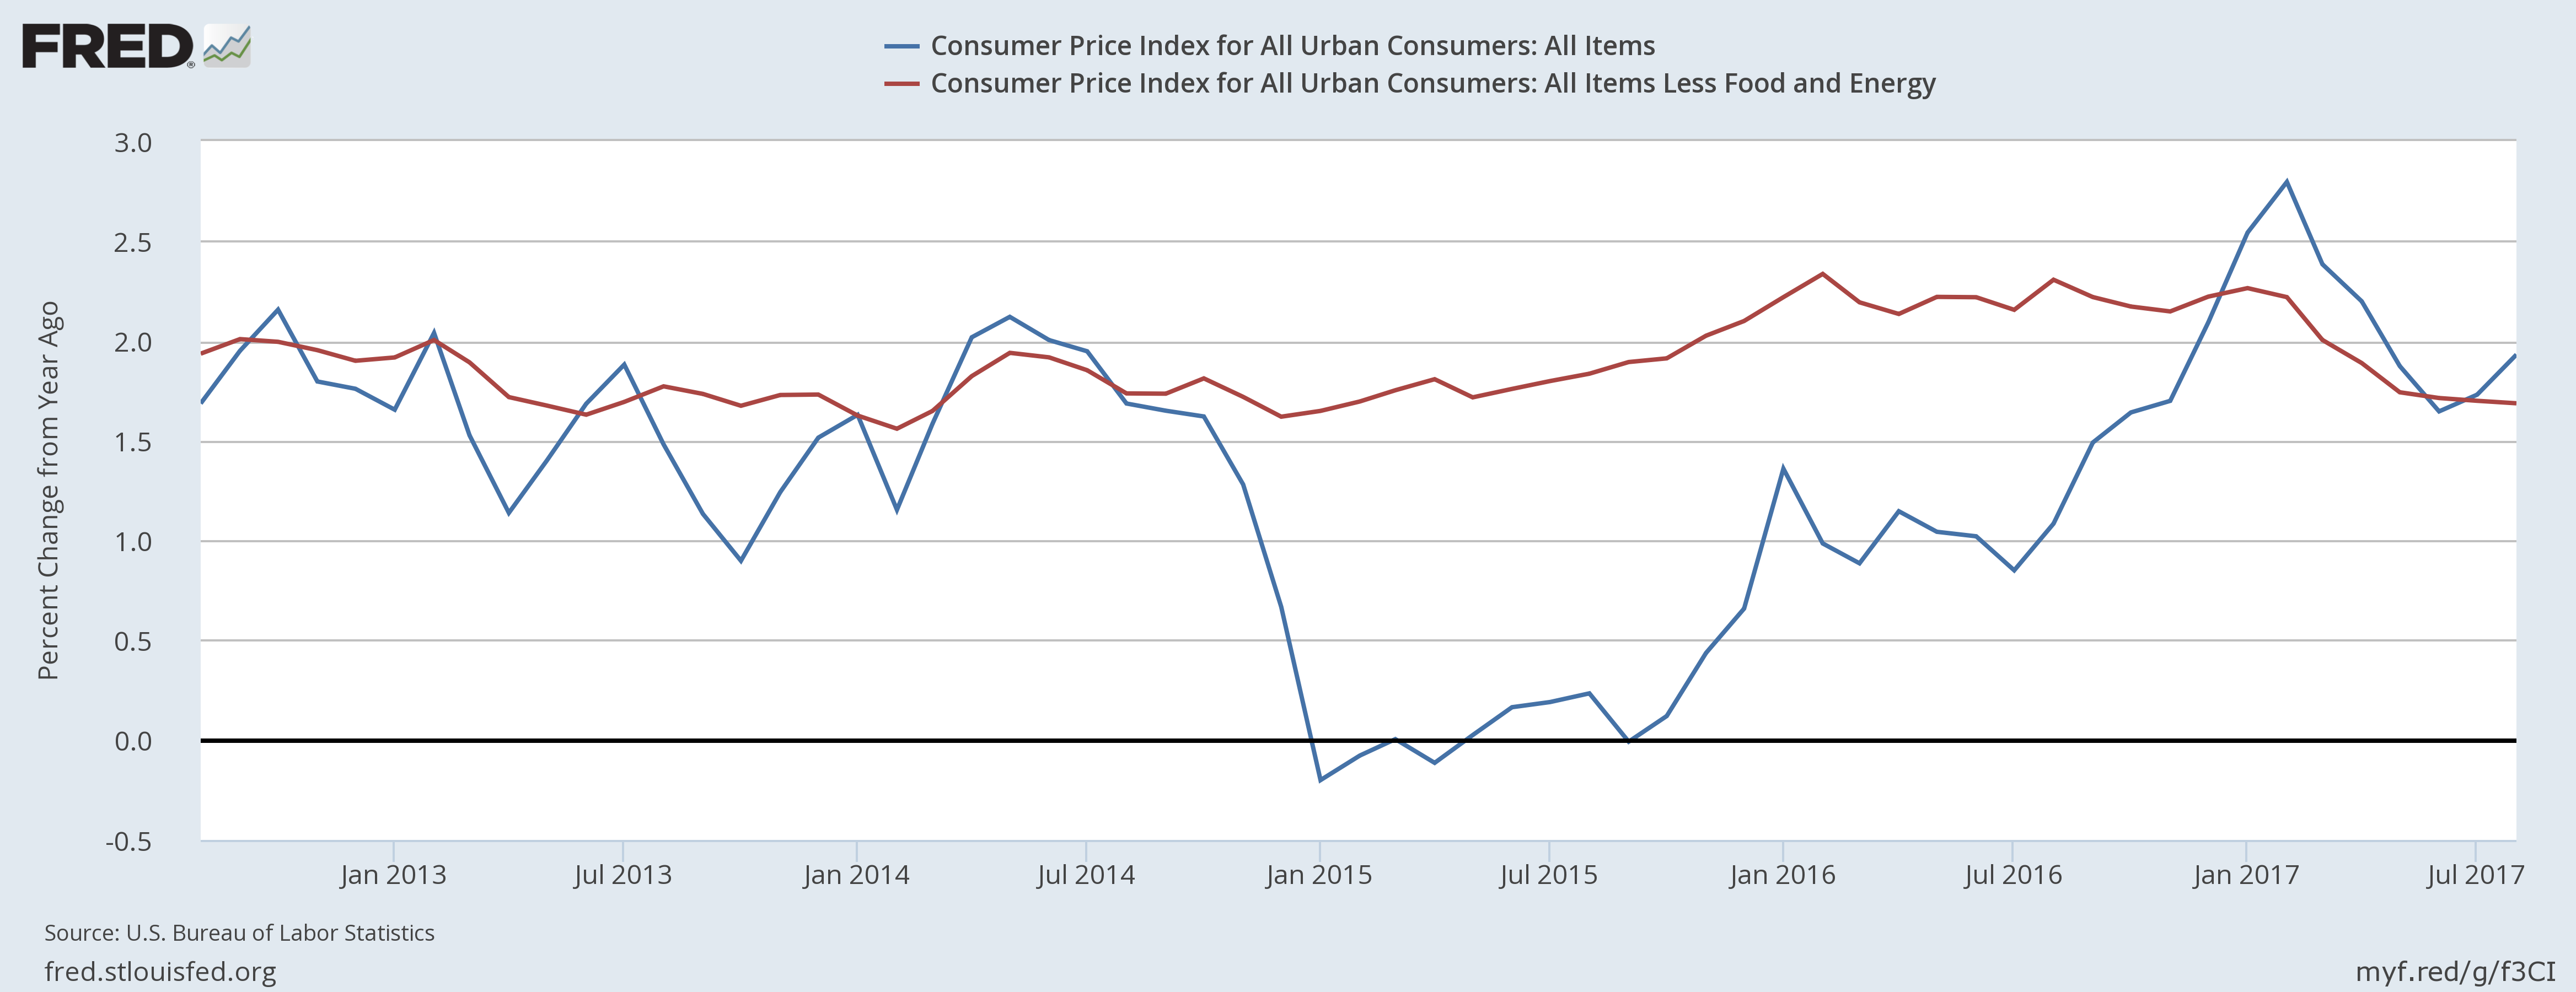
Inflation is contained. Overall CPI was 1.9% while core was 1.7%. The commodity price sub-indexes are balanced: food and energy prices (20% of the index) are up (1.1% and 6.4%, respectively) but commodity prices ex-food and energy (19% of CPI) were off -.9%. Service prices less energy (60% of CPI) advanced 2.5% Y/Y. The 5-year chart of the core and overall CPI show a clearly contained price structure:
Regarding retail sales and industrial production: Texas and Florida are two of the largest states, meaning that Hurricane Harvey and Irma will skew these numbers for the next few months.
Retail sales were down .2% M/M, but up 3.5% Y/Y. Ex-auto, sales were off 1.6%. The following charts highlight several major trends in the data:
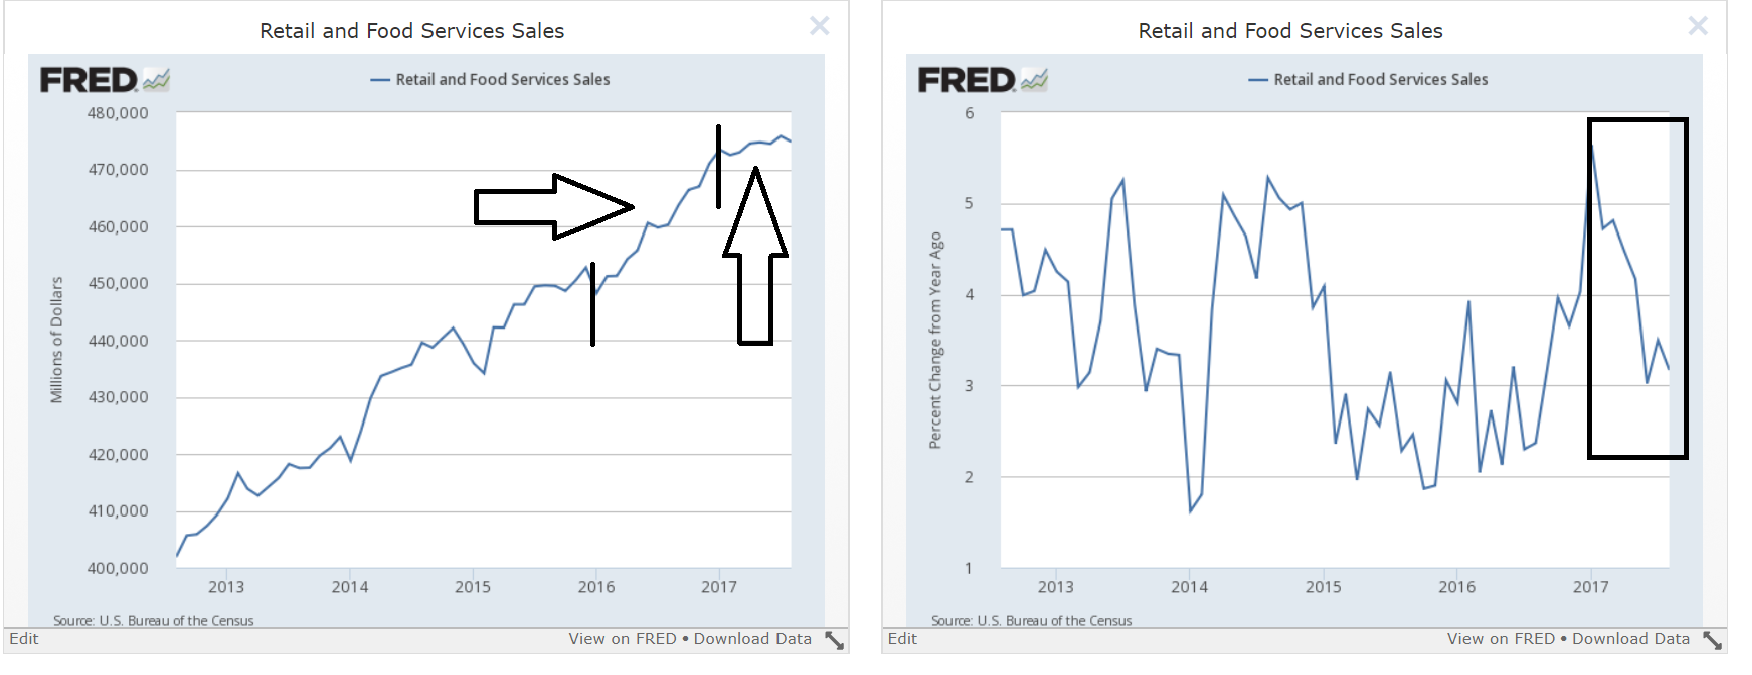
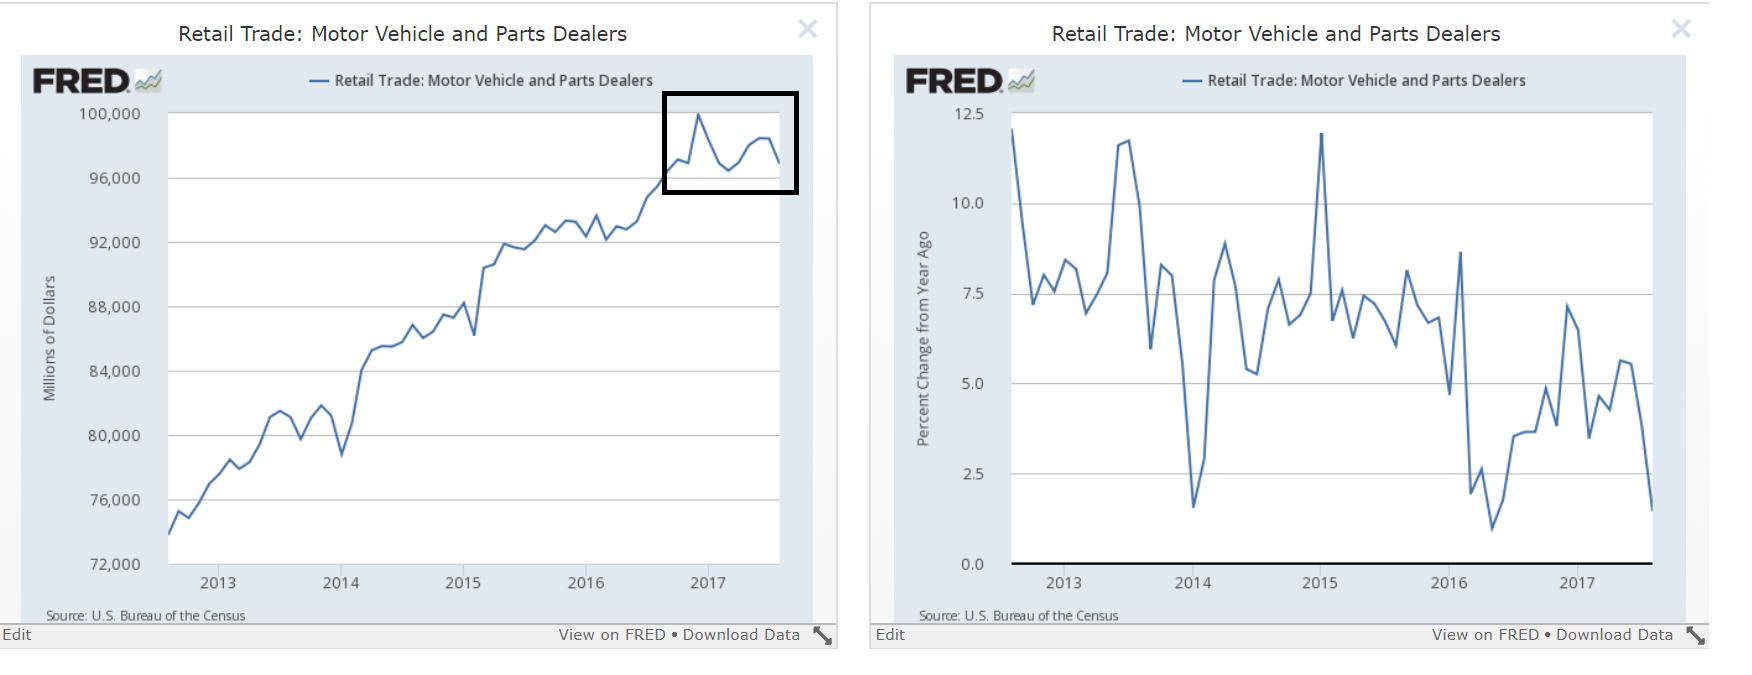
The top charts show the overall pace of retail sales is declining. By this time in 2016, retail sales had increased $12,073 million. This year that figure is $1,395 million – 11.5% of the previous year’s total. The bottom chart shows that auto sales have been moving more or less sideways since the beginning of the year which could mean this key metric may have topped for this cycle. The Y/Y percentage change has declined sharply as a result.
Industrial production declined .9%. The Federal Reserve believes Harvey is responsible for ¾ of this decline. All major sub-indexes were off regardless of the classification system (market or industry groupings).
Economic Conclusion: because of the hurricane-induced disruptions, no conclusions can be drawn.
Market Overview: this week, let’s start with a look at the long-end of the Treasury market:
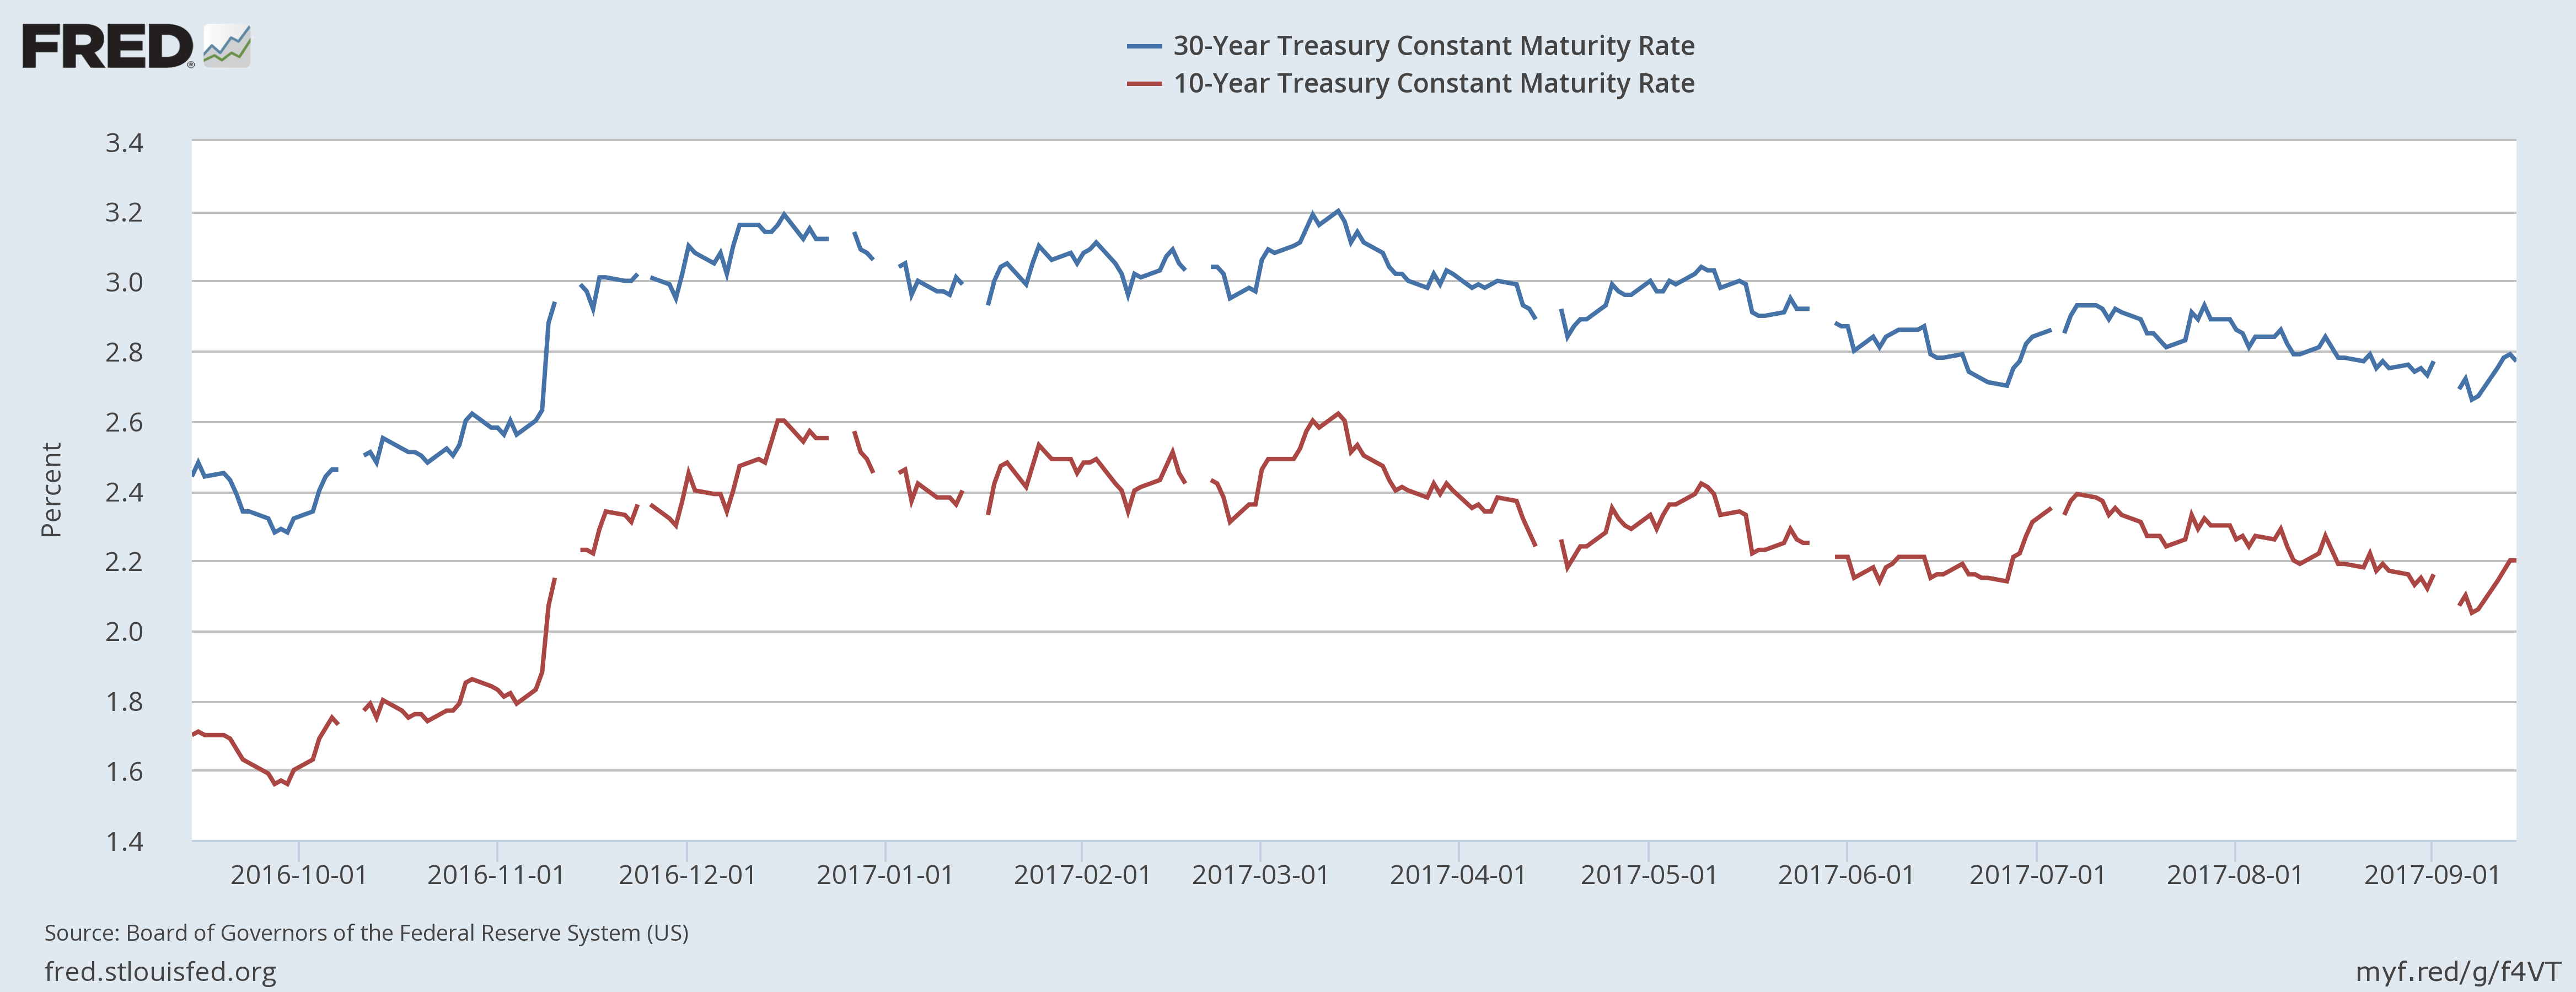
Since the election, the 30- and 10-year have each dropped about 40 basis points, meaning the bond market is sanguine about growth. The bond market’s post-election sell-off indicated traders believed we’d see a tax cut, regulatory reform, and a large infrastructure bill. Together, these events would cause higher growth and inflation. But nothing has happened, leading fixed income traders to conclude the economy is returning to its modest/moderate growth rate.
While the bond market is arguing for weaker growth, the stock market made new highs lasat week. But the details are a bit more modest:
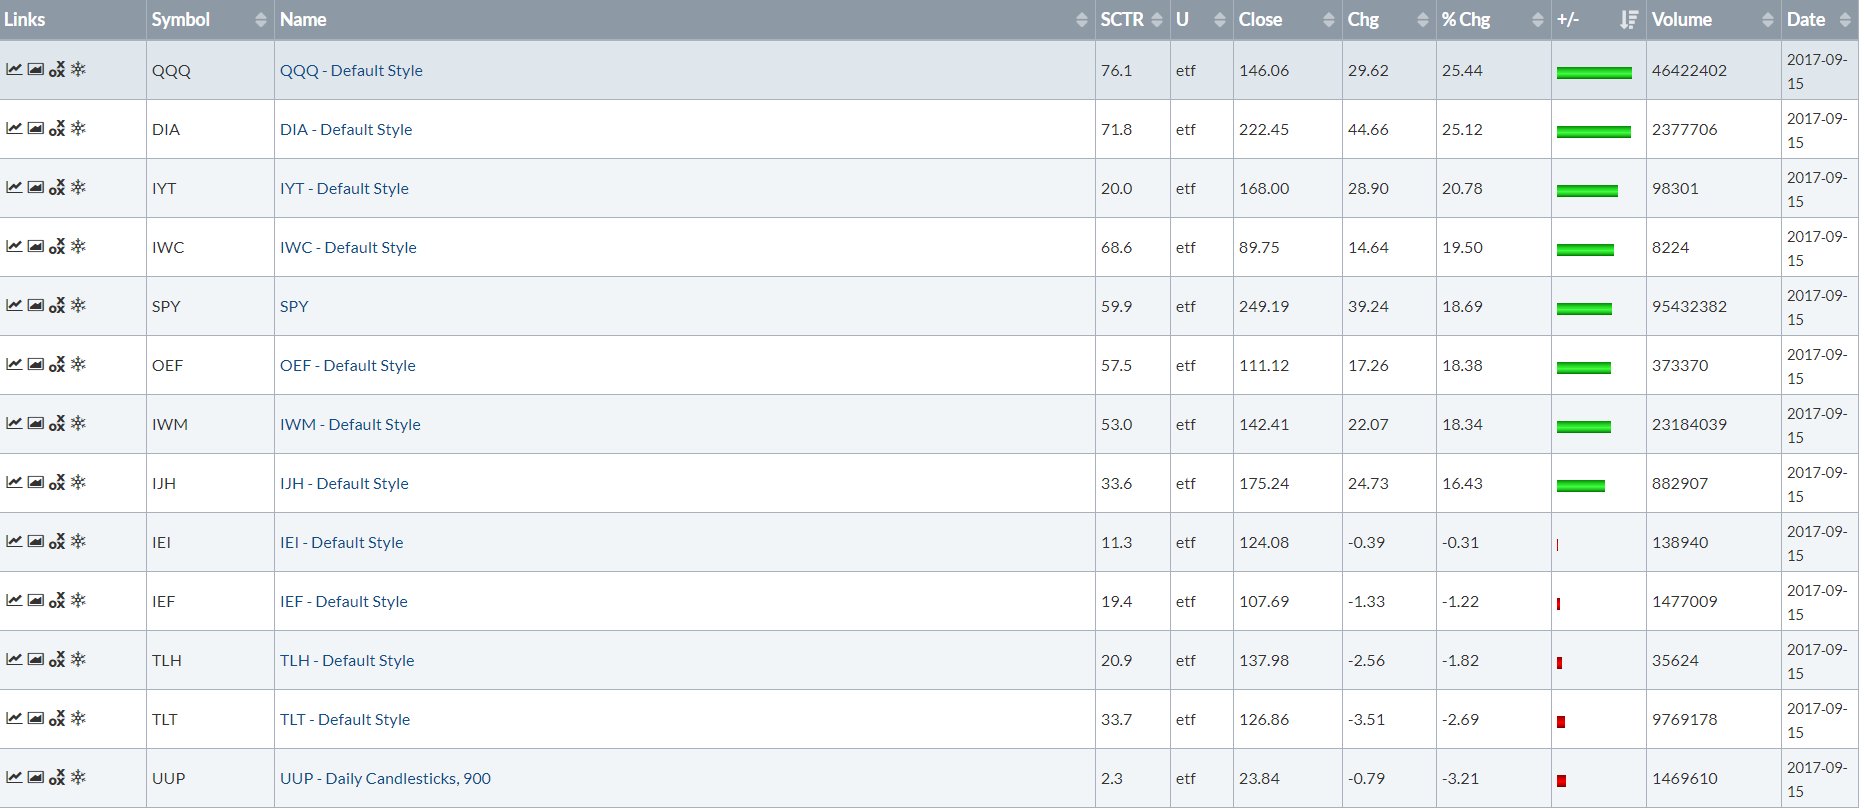

The top table shows the 1-year returns of a broad basket of ETFs. In that time, the QQQs are up 25% while the SPYs and IWMs each increased 18%; these are great results. But the bottom table shows the last 6 months; there the QQQs are up 11% while the SPYs and IWMs are up 6% and 4% respectively – certainly better than a decline, but also indicating there is clearly declining momentum.
And the daily chart adds additional modestly bearish color:
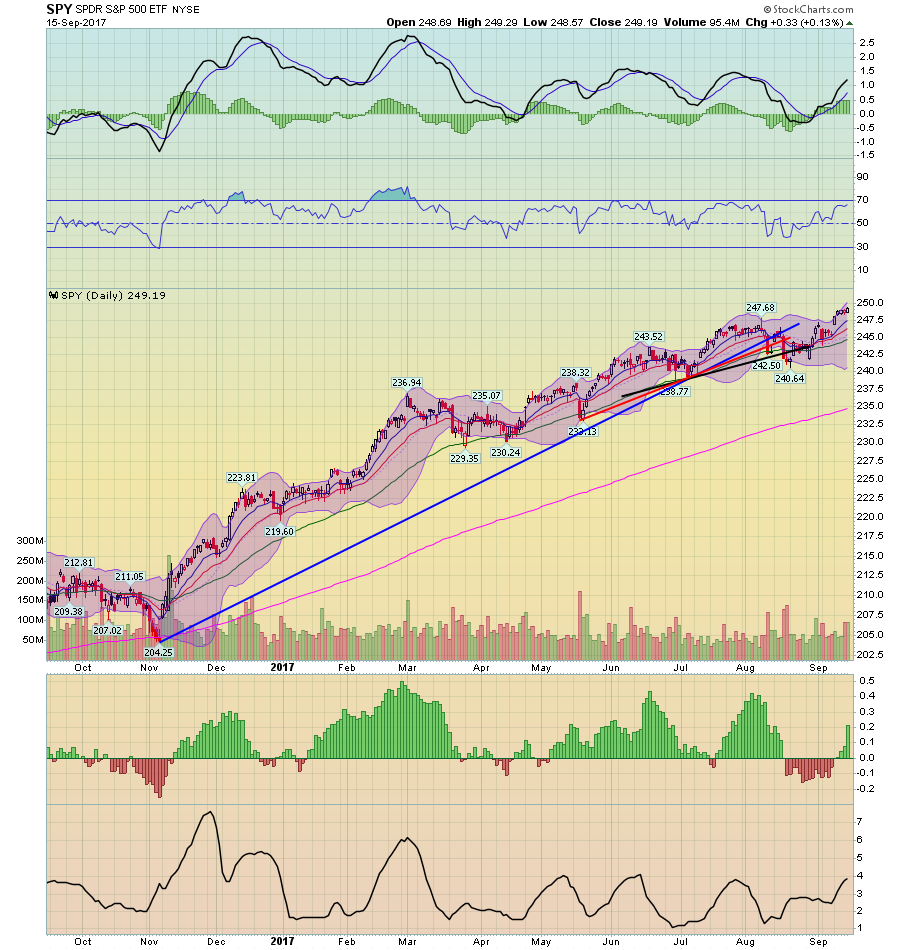
When the market hit its high there was no accompanying increase in volume, nor were there any strong candles. Instead, volume was tame and the price bars small. Although the market made a new high, we’re not seeing any meaningful accompanying technical data to support that. Add to that this chart of the equal weight QQQ:
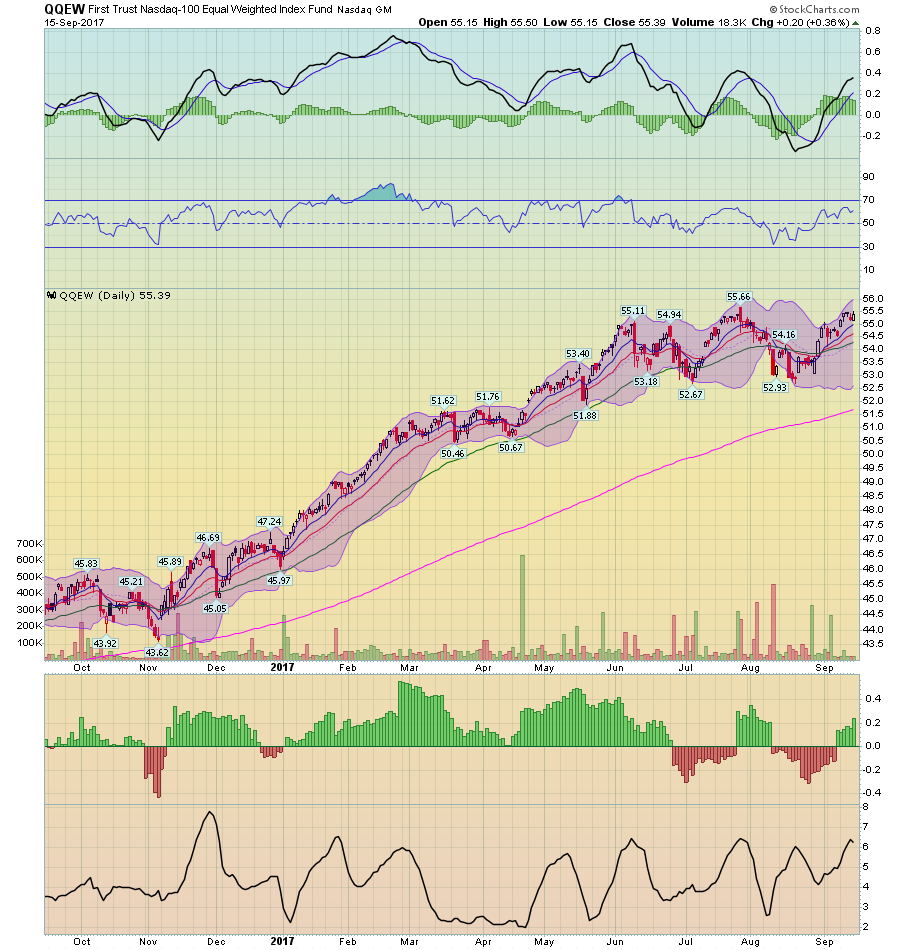
Rather than making new highs, this index is moving sideways. That tells us that the heavier weighted stocks are probably responsible for the bulk of the QQQ’s upside move.
Combining fundamental and technical inflation, we get the following picture: Thanks to two natural disasters, 3Q GDP will be lower. There is nothing in the long-leading or leading indicators pointing towards a permanent slowdown.
Ultimately, the net impact should be a net statistical wash: a short-term spike in unemployment claims will give way to more robust housing activity in two of the largest states. But this isn’t guaranteed. As for corporate profits, they are still projected to grow in 3Q17. But with the markets already expensive, there is limited upside room.
