Small cap stocks have been the market’s alpha dog, and its tail has been wagging the market. But now its tail is stuck between a rock and a hard place. This reveals a conundrum affecting the entire US stock market.
Here is a look at where small caps are stuck and what it reveals about stocks in general.
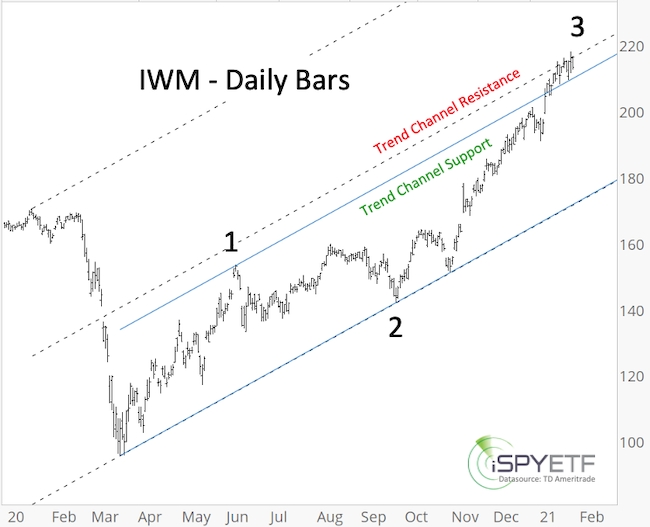
The daily chart of the iShares Russell 2000 ETF (IWM), the biggest small cap ETF, shows price has been wiggling higher.
That’s until recently, when it got stuck between two trend channels and corresponding support and resistance. 
Here is the conundrum: Price (and underlying breadth) has been strong, which is a long-term bullish factor. However, investor sentiment is extremely optimistic. Extreme optimism tends to precede the market running out of buyers willing to bid up price.
Considering this conundrum, now is a good time to ask: Is IWM more likely to break higher or lower?
To find the answer, we will first look at some historic context and then at one of the more colorful tools in the technical indicator tool box.
Historic precedent #1
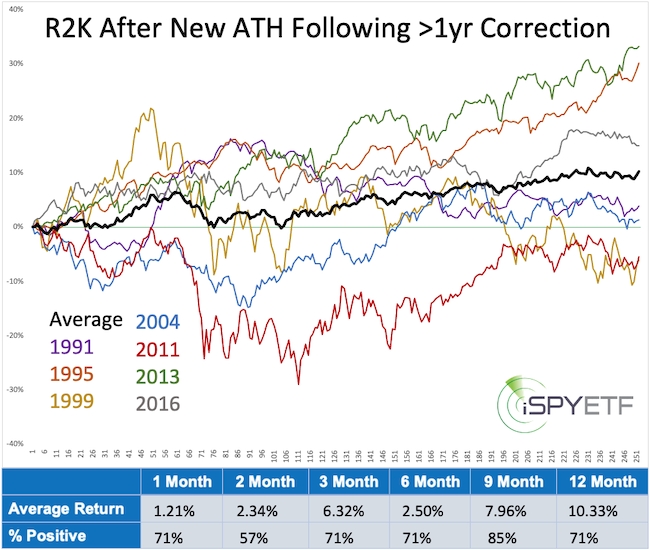
On November 13, 2020, IWM closed at an new all-time high for the first time since August 31, 2018. Since its inception, the Russell 2000 set a new all-time high after recovering from a correction that lasted at least one year, seven other time. The chart below shows the forward performance (for the next year) following the seven precedents. Here are two key takeaways:
- 76 and 104 trading days (about 3 - 5 months) later, the average return (black line) was close to 0%.
- Only in 1999 (orange line) did the Russell 2000 continue straight up, and that run stopped 51 trading days later. Don’t expect an exact 1999 repeat, but November 13 + 51 trading days takes us to January 28.

Historic precedent #2
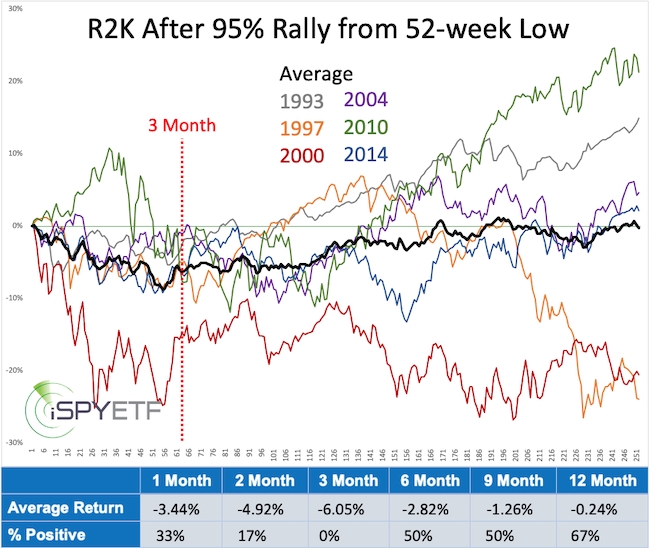
On December 15, 2020, IWM completed a 100%+ rally from its March low. Since its inception, the Russell 2000 rallied more than 95% from a 52-week low six other times.
The chart below shows the forward performance (for the next year) following the six precedents. Here are two key takeaways:
- The Russell 2000 traded lower every time three months later (dashed red line). The corresponding projected weak spot this time around would be around March 15, 2021.
- Only once, in 2010 (green line), did the rally continue, but only for another 34 trading days. Again, don’t expect an exact repeat, but December 15 + 34 trading days takes us to February 4.

When examining historic precedents, I don’t expect to find exact turning points but common themes, like weak spots.
Here is the common denominator of the above studies: Sustained gains from now on are historically and statistically unlikely.
Elliott Wave Theory
Elliott Wave Theory can provide some helpful “we are here” type of information. The rally from the October low has been strong and relentless, which is indicative of a wave 3 rally. Here is what usually happens once a wave 3 rally concludes:
- Wave 4 corrects part of the wave 3 rally (commonly in the Fibonacci range of 23.6% - 38.2%) before wave 5 moves to new highs.
- Wave 3 marks the end of a counter rally to be followed by much lower prices.
It’s too early to tell which way the market will go, but either way, any remaining upside from here on comes with high risk of a pullback.
Conclusion
While the above analysis is focused on small cap stocks, keep in mind that small caps have not only been leading the overall market. Because of their sheer number, they’ve also had a huge positive impact on breadth gauges (I.e. advance/decline ratio, up/down volume ratio, etc.). Small cap weakness would impact breadth negatively and increase the odds of a bigger broad market pullback.
Based on the weight of evidence, IWM is likely to give back any gains accrued from here on out.
In terms of trading, chasing this rally is risky (and gains should be locked in before they vanish). Buying the dip (the bigger the dip the better) or selling the rip (the bigger the rip the better) seems like a more promising approach. Persistent trade above the dashed resistance level would be an indication that IWM does not want to conform to historical patterns.
