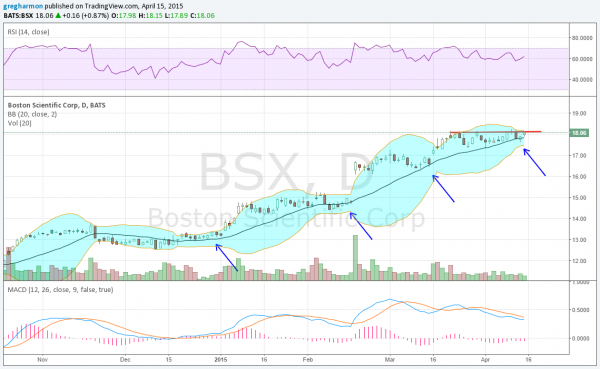
Many stocks have a rhythm to them. They move in repeated patterns over and over…..until they don’t any more. When you find one that exhibits that kind of price behavior it's worth noting and stalking for a potential trade. One that I uncovered recently is Boston Scientific (NYSE:BSX). The stock has a lot going for it. It's in a hot sector (healthcare) and crosses over into another hot sector (technology).
What interests me though is the chart of the stock's price action over the last 6 months. The chart below shows that 3 things stand regarding price action. The first is that every time the price has touched the 20-day SMA it has lead to a new leg higher in the price. Second, the Bollinger Band® squeezes have also preceded a break to the upside. Finally, when the stock has consolidated for more than a month it takes another step higher.
All three of these things are occurring in the chart right now. Is it a perfect storm for the next leg up? The RSI is bullish while the MACD has reset lower. These suggest it could be prepping for a move as well. And if it does move over resistance at 18.10 the prior history would target a Measured Move to about 19. Have you been waiting to get into this stock? This may be your chance.

