At the beginning of the year, it was easy to find people discussing the idea that reflation/growth was going to take place in the economy and many positioned portfolios accordingly. Now that we find ourselves at the mid point of the year, we wanted to take a look at an indicator that is pretty good at letting us know how the reflation theme is really doing.
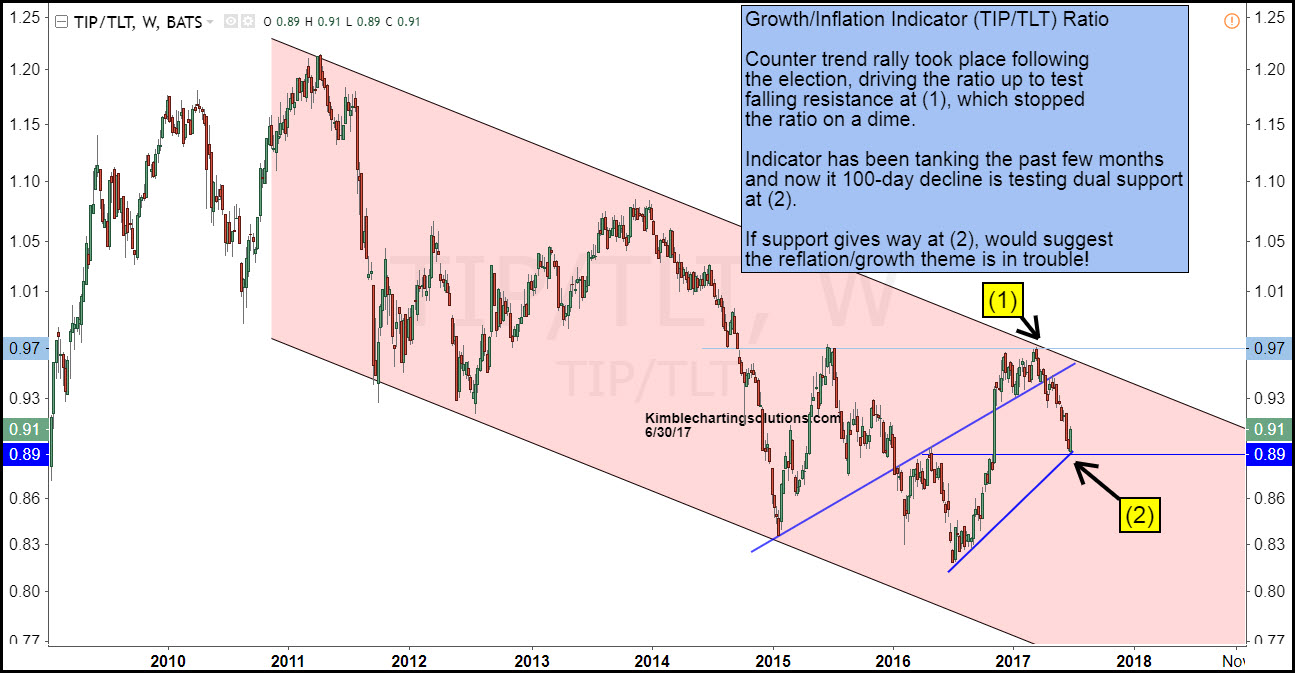
Below is an update on the TIP:TLT ratio.
As the reflation theme was getting popular at the start of the year, the TIP:TLT ratio was hitting 2015 highs and 6-year falling channel resistance at (1).
The reflation indicator stopped on a dime as it was hitting dual resistance at (1) and that's where portfolios should have been selling reflation assets — not buying them.
The swift decline in the ratio now has it testing dual support at (2). What happens at (2) will give investors a good look at where the reflation theme heads. Now, many are starting to question the idea of the reflation theme as this support test is taking place. As this support zone was hit this week, yields rose sharply and bonds gave back some of their recent gains.
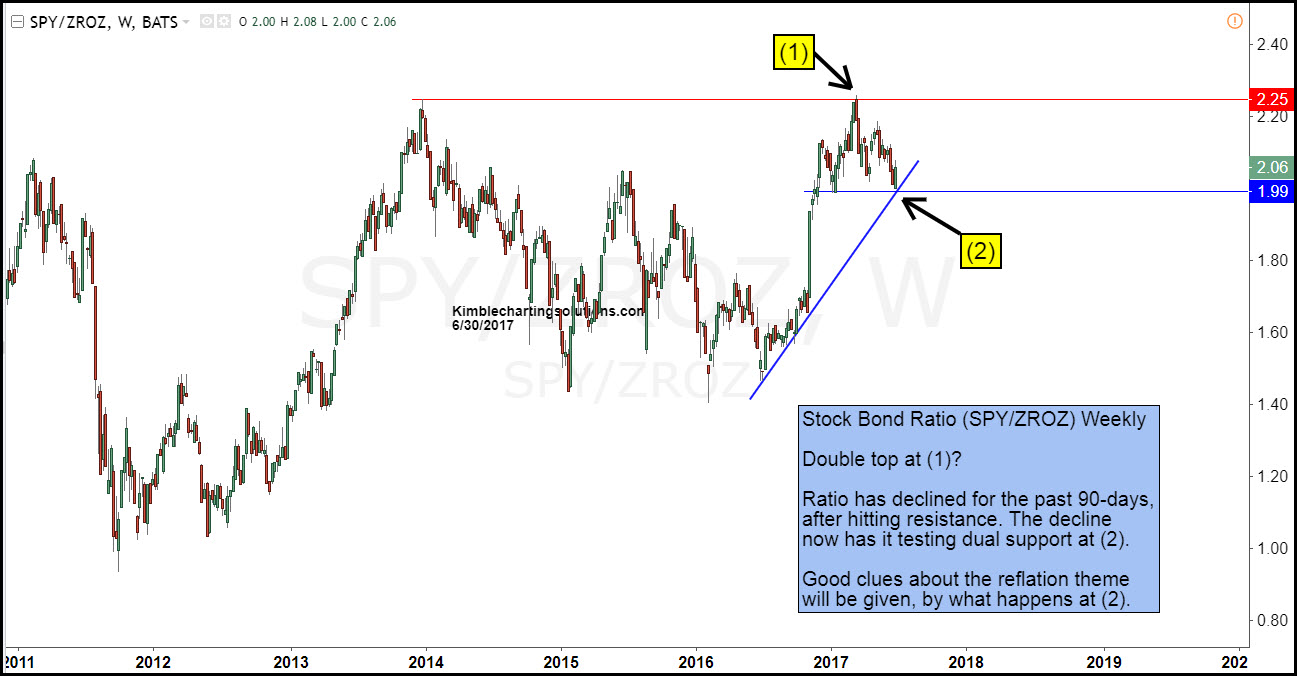
Is the reflation theme now hitting a key support level and about to reverse higher as many are saying the reflation theme is a bust? Below updates the Stock:Bond ratio, which could give quality clues as to where the reflation theme is going.
Both the inflation indicator (TIP:TLT) and the Stock:Bond indicator (ZROZ:SPY) are testing key support levels at the same time.
The Power of the Pattern suggests that what both of the ratios do at these support tests will send a quality message to investors about where portfolios should be positioned for the next 6 months.


