This Energy Play Is Looking At A Golden Cross

Published 05/09/2016, 03:35 PM
Updated 05/14/2017, 06:45 AM
CVA
-

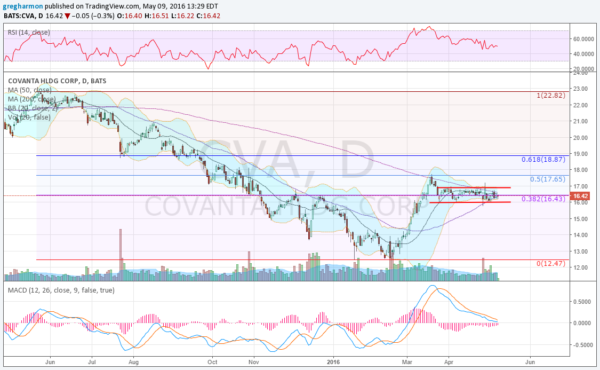
Covanta Holding Corporation (NYSE:CVA) has had a rough time for most of the past year. Last May it started a smooth ride lower from consolidation at 23 to a low in February at $12.50 -- more than 50% lower. And that consolidation at 23 was after a fall from the all-time high above 25.

The bounce that followed gave it a quick retracement of 50% of the down leg, which then took it to the 200-day SMA. The price rejected from there, though, and pulled back to the 38.2% retracement where it has been vacillating since then. Six weeks of sideways motion followed. And during that time the Bollinger Bands® have grown very tight -- often a precursor to a move.

Covanta

As it churns, the RSI is holding in the bullish zone and the MACD has reset lower, still in positive territory. There's also a Golden Cross that will print this week, with the 50-day SMA crossing up through the 200-day SMA. A range of 90 cents defines this stock until it breaks out. Once it breaks 16.90, watch for a run to 18.87 or higher. A move below 16.00 points to a retracement to the lows.

Do you have the energy to wait and watch?

Latest comments

Loading next article…
Risk Disclosure: Trading in financial instruments and/or cryptocurrencies involves high risks including the risk of losing some, or all, of your investment amount, and may not be suitable for all investors. Prices of cryptocurrencies are extremely volatile and may be affected by external factors such as financial, regulatory or political events. Trading on margin increases the financial risks.
Before deciding to trade in financial instrument or cryptocurrencies you should be fully informed of the risks and costs associated with trading the financial markets, carefully consider your investment objectives, level of experience, and risk appetite, and seek professional advice where needed.
Fusion Media would like to remind you that the data contained in this website is not necessarily real-time nor accurate. The data and prices on the website are not necessarily provided by any market or exchange, but may be provided by market makers, and so prices may not be accurate and may differ from the actual price at any given market, meaning prices are indicative and not appropriate for trading purposes. Fusion Media and any provider of the data contained in this website will not accept liability for any loss or damage as a result of your trading, or your reliance on the information contained within this website.
It is prohibited to use, store, reproduce, display, modify, transmit or distribute the data contained in this website without the explicit prior written permission of Fusion Media and/or the data provider. All intellectual property rights are reserved by the providers and/or the exchange providing the data contained in this website.
Fusion Media may be compensated by the advertisers that appear on the website, based on your interaction with the advertisements or advertisers.
© 2007-2025 - Fusion Media Limited. All Rights Reserved.