In the last month or so a kind of stealth move has been taking place in an unlikely energy commodity.
Natural gas, the poster child for overproduction last year as energy prices collapsed seems to have found a bottom. Indeed, if price action is to be believed it is even possible that we are witnessing the beginning of a significant rally in the commodity. Of most interest to investors though is that as gas begins to edge upwards, stocks in the industry are still under pressure.
There is a perfectly logical explanation for that, and it is a product of a basic disconnect in the stock market that often provides opportunities for energy investors. Even though the stock market has a function as a forward discounting mechanism, there is still a tendency for traders to look backwards at times and react to earnings numbers that are, by their nature, a record of what has already happened.
Commodity futures, on the other hand, are, by definition, about the future. Thus, even as the futures market is indicating cautious optimism about natural gas prices, stocks in the industry are being depressed by poor results from the first half of the year.
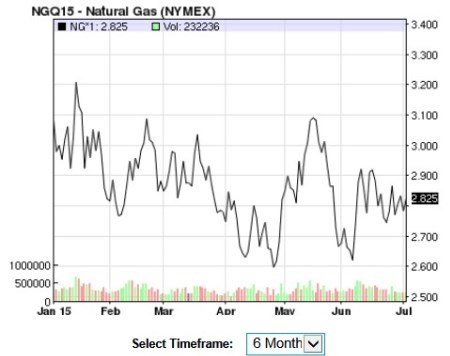
That optimism in the commodity market is based on the fact that a solid base around the $2.60 level has formed.

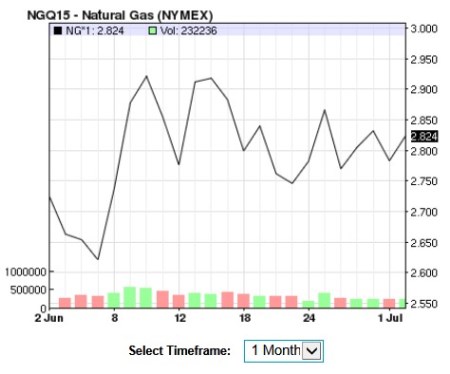
If we shorten the timeframe of the chart and look more closely at the one month action an even more positive pattern of gradually higher lows becomes clear.

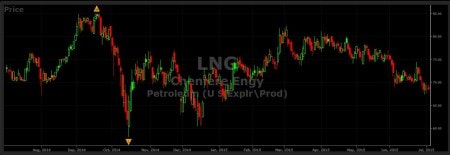
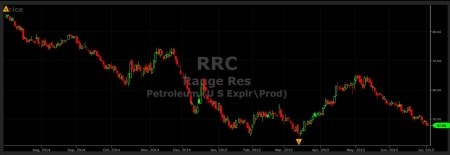
This would suggest that buyers have the upper hand, and that a gradual return to levels approaching $3 and even a break above that psychologically important level is imminent. If that does occur, then obviously it would give a boost to the prospects of E&P companies with a focus on natural gas, such as Cheniere Energy Inc (ARCA:LNG) and Range Resources (NYSE:RRC). As you can see though, neither stock is reflecting that, but instead they are continuing to be weighed down by recent results.
[BREAKING]: Trader who "Broke the Bank of England" grants first interview
Since 1992 his secrets were locked away in his brain… but just recently he agreed to a private interview. It was all caught on camera… and what he has to say will change everything you think you know about trading. But you need to see it now… before it’s removed from the Internet again. View it (if it's still available) now...


As a result, both LNG and RRC are close enough to support levels to offer a reasonable exit level if you were to buy here. In the case of LNG a stop at around the $60 level would limit potential losses to 11 or 12 percent, while a stop just below RRC’s 52 week low of $43.88 would represent a cut for around a 9 percent loss if things didn’t pan out. With both stocks offering at least a 20 percent upside if natural gas were to re-establish above the $3 level that makes for a decent risk/reward ratio.
It should be noted that this is a sideways play on rising natural gas prices. Some may prefer the pure play of buying futures which also looks attractive at these levels. On balance, however, given the fact that news of a historical nature has kept LNG and RRC from reacting to the gradual edging up in natural gas, the stocks offer a better play for most investors.
