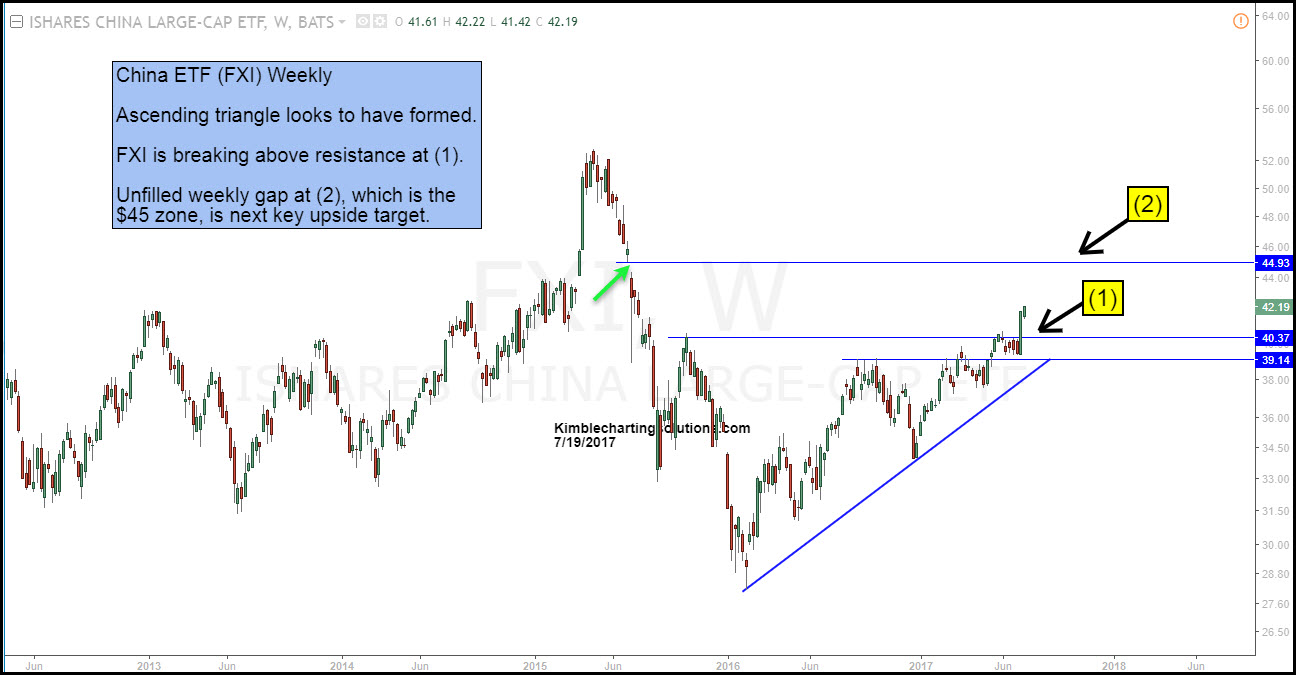
China ETF FXI started falling hard back in 2015. While doing so, it left a large unfilled weekly gap on the charts. Does that gap represent an opportunity?
It's very possible.
Below looks at FXI on a weekly basis over the past 4 years.

Over the past 9 months, FXI looks to have formed a bullish ascending triangle, where it seems to have broken out to the upside before coming back to test old resistance, as new support. A continued rally now has it breaking above resistance at (1).
FXI looks to have created a large unfilled weekly gap near the $45 zone at (2). If FXI can continue to attract buyers, it could continue to rally and fill the gap at (2), which is nearly 10% above current prices.
Full Disclosure: Premium and Sector members are long FXI due to the bullish ascending triangle pattern.
