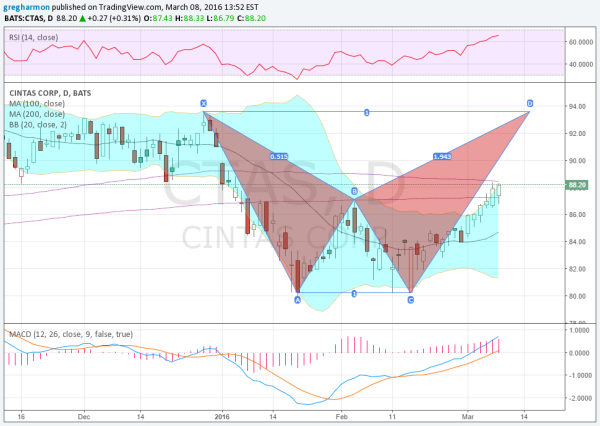
Cintas Corporation (NASDAQ:CTAS) was a steady riser over the last 4 years. That changed last March as the move higher shifted to more of a sideways consolidation followed by a couple of small steps higher. The final step lasted until the end of 2015. With the turn of the calendar, the uniform maker’s stock price started to plummet, finding a bottom in mid January.
A bounce brought the price back to the flat 200-day SMA at the start of February, retracing about half of the move down. The price failed to push higher there and then fell back to the prior low by President’s Day. But since then it has been rising -- again. This time it has moved over the high at the beginning of February and the 200-day SMA.
This higher high triggers a buy signal and looks for the price to retrace the full move lower in what would be a “W” up to 93.50. The 100-day SMA appears to be in the way and a gap from 89.75 to 90.95. But momentum supports a push higher with the RSI rising in the bullish zone and the MACD rising and positive. The Bollinger Bands® have also opened and price is riding them higher. Consider using the B point as a stop and get long now or over the 100-day SMA for a trade higher.

