NVDA Q3 Earnings Alert: Why our AI stock picker is still holding Nvidia stockRead More

This Bank Is On The Edge Of A Bullish Move

Published 10/05/2016, 03:18 PM
Updated 05/14/2017, 06:45 AM
OZK
-

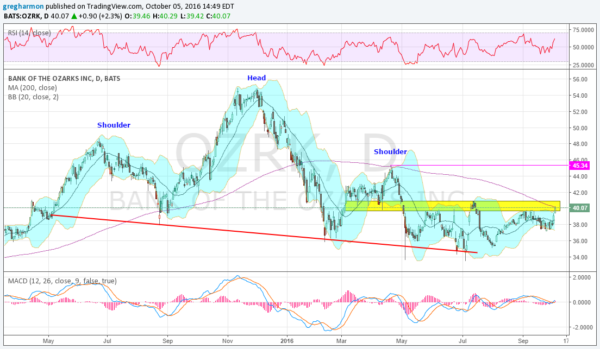
The chart for Bank of the Ozarks (NASDAQ:OZRK) below reveals a mountain-like pattern from May 2015 through this past May. In fact it is formally known as a Head-and-Shoulders topping pattern. That pattern gives a price objective to 18 on the downside on a trigger. And that trigger happened with a move below the neckline in June. But the downside has never materialized. In fact, the price stayed below the trigger for less than a day.
Bank of the Ozarks

Now that bearish chart has morphed into a sideways consolidation for nearly 5 months. The picture, though, is starting to brighten -- perhaps with a second shift to the upside. With a touch at the 200-day SMA Wednesday, the stock is on the edge of a bullish move and is in the middle of a resistance/support zone as the momentum indicators are looking up. The RSI is rising in the bullish zone and the MACD is crossing up. And with over 10% short interest, this stock has room to run if the shorts get spooked.

Look for a move over 41 to get bullish and then over the right Shoulder of that Head-and-Shoulders pattern at 45.34 to negate the pattern, which would firmly back a bull move.

Latest comments

Loading next article…
Risk Disclosure: Trading in financial instruments and/or cryptocurrencies involves high risks including the risk of losing some, or all, of your investment amount, and may not be suitable for all investors. Prices of cryptocurrencies are extremely volatile and may be affected by external factors such as financial, regulatory or political events. Trading on margin increases the financial risks.
Before deciding to trade in financial instrument or cryptocurrencies you should be fully informed of the risks and costs associated with trading the financial markets, carefully consider your investment objectives, level of experience, and risk appetite, and seek professional advice where needed.
Fusion Media would like to remind you that the data contained in this website is not necessarily real-time nor accurate. The data and prices on the website are not necessarily provided by any market or exchange, but may be provided by market makers, and so prices may not be accurate and may differ from the actual price at any given market, meaning prices are indicative and not appropriate for trading purposes. Fusion Media and any provider of the data contained in this website will not accept liability for any loss or damage as a result of your trading, or your reliance on the information contained within this website.
It is prohibited to use, store, reproduce, display, modify, transmit or distribute the data contained in this website without the explicit prior written permission of Fusion Media and/or the data provider. All intellectual property rights are reserved by the providers and/or the exchange providing the data contained in this website.
Fusion Media may be compensated by the advertisers that appear on the website, based on your interaction with the advertisements or advertisers.
© 2007-2024 - Fusion Media Limited. All Rights Reserved.