Over the past few months, PowerShares Aerospace & Defense (PPA) has shown great relative strength to the benchmark S&P 500 Index.
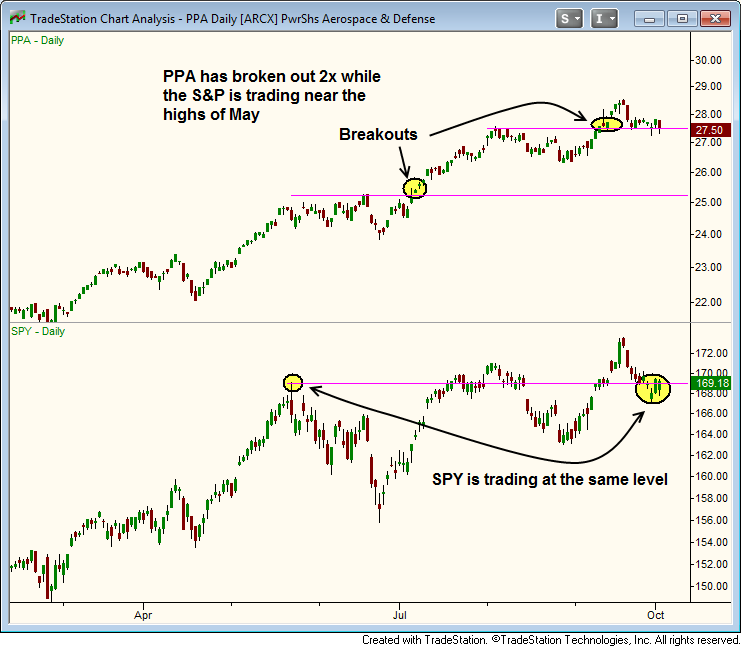
On the daily chart below, notice that $PPA has broken out twice over the past few months, setting higher highs and higher lows along the way.
During that same period, the S&P 500 SPDR (SPY) has basically gone nowhere:
If a stock or ETF is so strong that is manages to continue trending higher, even while the broad market is going sideways, that equity typically surges much higher when the major indices eventually rally as well.
Assessing the relative strength of an ETF versus the main stock market indexes is the key element behind my proven ETF trading strategy.
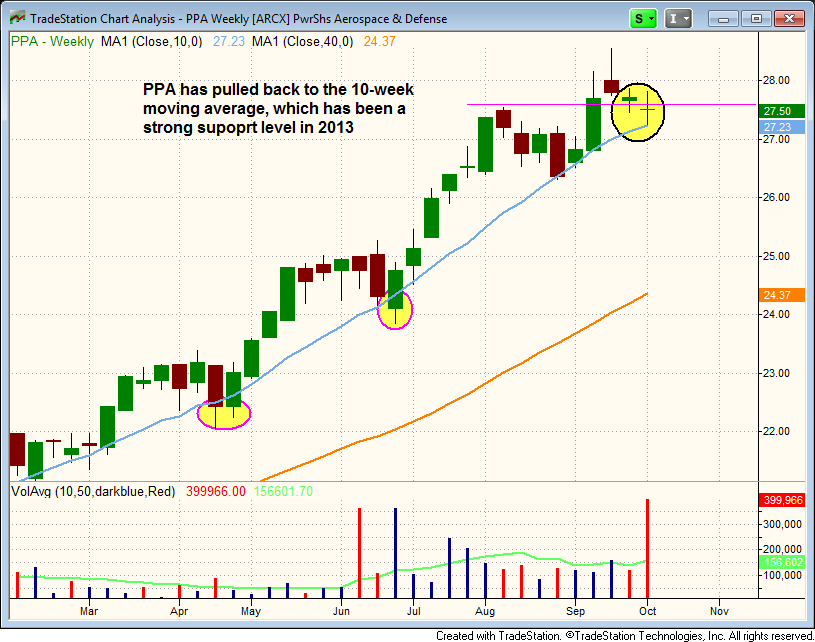
Since breaking out to new highs three weeks ago, PPA has pulled back to support of its rising 10-week moving average, which has held up all year during every pullback (10-week MA is roughly the same as the 50-day MA).
This rock-solid support of the 10-week moving average is shown on the weekly chart below:
Because of the current pullback to the 10-week MA, we expect the price action to hold at or around this level over the next week or two before the uptrend resumes.
As such, PPA now provides us with a low-risk buy entry point, and we are stalking PPA for potential swing trade entry going into today’s session.
Although this PPA trade may not lead us to a whopping 40% gain, like the Guggenheim Solar ETF (TAN) trade we finally closed this week, the current pullback provides us with a positive reward-risk ratio and clearly defined protective stop price below major support.
Original post
- English (UK)
- English (India)
- English (Canada)
- English (Australia)
- English (South Africa)
- English (Philippines)
- English (Nigeria)
- Deutsch
- Español (España)
- Español (México)
- Français
- Italiano
- Nederlands
- Português (Portugal)
- Polski
- Português (Brasil)
- Русский
- Türkçe
- العربية
- Ελληνικά
- Svenska
- Suomi
- עברית
- 日本語
- 한국어
- 简体中文
- 繁體中文
- Bahasa Indonesia
- Bahasa Melayu
- ไทย
- Tiếng Việt
- हिंदी
This Aerospace & Defense ETF Is Poised To Fly Higher
Published 10/03/2013, 07:34 AM
Updated 07/09/2023, 06:31 AM
This Aerospace & Defense ETF Is Poised To Fly Higher
Latest comments
Loading next article…
Install Our App
Risk Disclosure: Trading in financial instruments and/or cryptocurrencies involves high risks including the risk of losing some, or all, of your investment amount, and may not be suitable for all investors. Prices of cryptocurrencies are extremely volatile and may be affected by external factors such as financial, regulatory or political events. Trading on margin increases the financial risks.
Before deciding to trade in financial instrument or cryptocurrencies you should be fully informed of the risks and costs associated with trading the financial markets, carefully consider your investment objectives, level of experience, and risk appetite, and seek professional advice where needed.
Fusion Media would like to remind you that the data contained in this website is not necessarily real-time nor accurate. The data and prices on the website are not necessarily provided by any market or exchange, but may be provided by market makers, and so prices may not be accurate and may differ from the actual price at any given market, meaning prices are indicative and not appropriate for trading purposes. Fusion Media and any provider of the data contained in this website will not accept liability for any loss or damage as a result of your trading, or your reliance on the information contained within this website.
It is prohibited to use, store, reproduce, display, modify, transmit or distribute the data contained in this website without the explicit prior written permission of Fusion Media and/or the data provider. All intellectual property rights are reserved by the providers and/or the exchange providing the data contained in this website.
Fusion Media may be compensated by the advertisers that appear on the website, based on your interaction with the advertisements or advertisers.
© 2007-2024 - Fusion Media Limited. All Rights Reserved.
