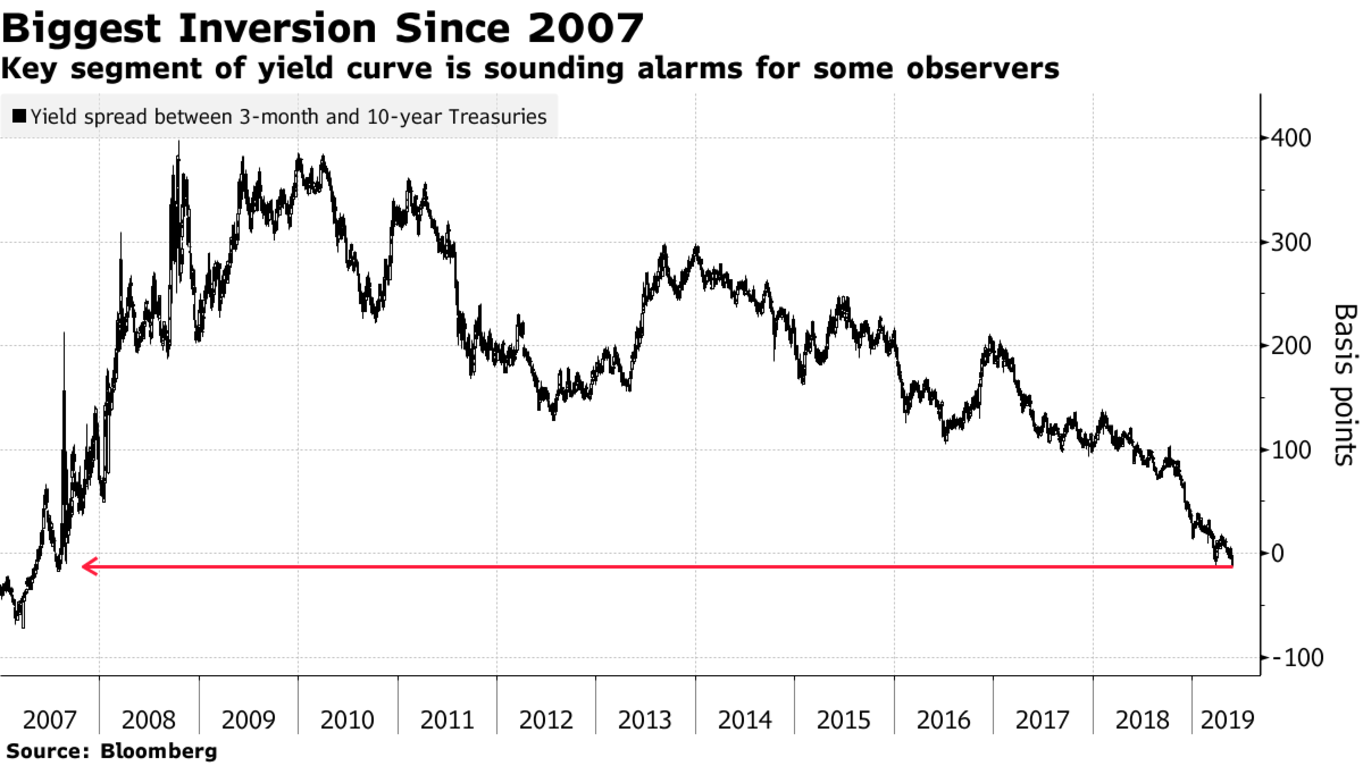
While the mainstream financial media focuses on the U.S.-China trade-war – macro-speculators are eyeing global yield curves – which are now signaling trouble.
But according to this ‘adjusted’ U.S. yield curve – a recession may be coming much sooner than many expect.
Let me explain. . .
First – here’s some context: back in early December 2018, the U.S. yield curve inverted for the first time since the Great Recession of 2008 (the 5-Year bond yielded less than the 3-Year bond).
Then – after a month of turmoil – things looked slightly better in the first quarter of 2019 (at least in the market’s eyes). And the yield curve slipped out of the inversion.
But now – just a few days ago – a very important segment of the U.S. yield-curve – the spread between the 3-month bill and 10-year bond – inverted its most since 2007.
Meaning – the 10-Year bond now yields less than the 3-month bill. . .

Now – this is a deep inversion.
And – historically – when this part of the yield-curve inverts – a recession follows over the next 8-24 months.
(This has held true for the last seven straight recessions in the U.S.).
And since it just happened – the market’s beginning to price in the possibility of a recession happening sometime next year.
But – here’s the problem. . .
If you adjust the yield-curve (which Morgan Stanely has) to account for years of the Fed’s quantitative easing (QE – aka money printing) and quantitative tightening (QT – aka sucking money out of the system) – then you would see that the yield-curve’s actually been chronically inverted for the last six months.

Thus – this adjusted curve suggests that the risk of a recession may happen sooner than many believe (by at least six months).
Also – this curve tells a much different story than what the mainstream financial media’s been sharing.
For instance – the mainstream has preached that the recent escalation in the U.S.-China trade-war is what sent yields sinking into inversion.
But – according to Morgan Stanely – this part of the yield curve (the 3-month-and-10-year) actually inverted back in December. And has stayed inverted ever since.
This really shouldn’t come as a surprise. . .
Because ever since late-2018 – there’s been disappointing economic data coming out from around the world (especially from major economies).
Whether it’s weak German manufacturing – or plunging world-trade volumes – or deteriorating economic data from China.
So – in summary – the recent ‘big inversion’ wasn’t so recent after all.
And if history means anything here – then the risk of a recession showing up may happen sooner than many expect.
I’ve written before that – contrary to public opinion – there’s strong evidence indicating yield inversion actually triggers slowing growth and recessions. (For instance – major banks and lending institutions begin curtailing new loans and refinancing as lending profits deteriorate).
But – regardless of a recession happening sooner or later. I believe market volatility will pick up over the next several months.
And that the market may be in for a big surprise.
