If you’re not yet as filthy rich as you hoped you’d be by now, don’t worry—we still have plenty of time to get you there.
And I’m not talking about investing your “growth capital” into risky fly-by-night names in hopes of buying high and selling higher. We can scale our money more securely—and just as spectacularly—by purchasing sound dividend payers that happen to be growing their payouts rapidly. Here’s why.
There are three—and only three—ways a company’s stock can pay us:
- A cash dividend.
- A dividend hike.
- By repurchasing its own shares.
Everyone loves the dividend, but investors usually don’t give enough love to the dividend hike. Not only do these raises increase the yield on your initial capital, but also they often are reflected in a price increase for the stock.
For example, if a stock pays a 3% current yield and then hikes its payout by 10%, it’s unlikely that its stock price will stagnate for long. Investors will see the new 3.3% yield and buy more shares.
They’ll drive the price up, and the yield back down, eventually toward 3%. This is why your favorite dividend “aristocrat”—a company everyone knows and has paid dividends forever—never pays a high current yield. Its stock price rises too fast!
Academic studies support the virtues of dividend growth investing. Ned Davis Research, for example, conducted an oft-quoted study that found that between 1972 and 2010, the S&P 500’s average annual return was 7.3%, but dividend growers averaged 9.6%.
However, Argus Research did a more recent follow-up on this analysis. And no surprise, the firm came to a similar bullish conclusion about higher payouts.
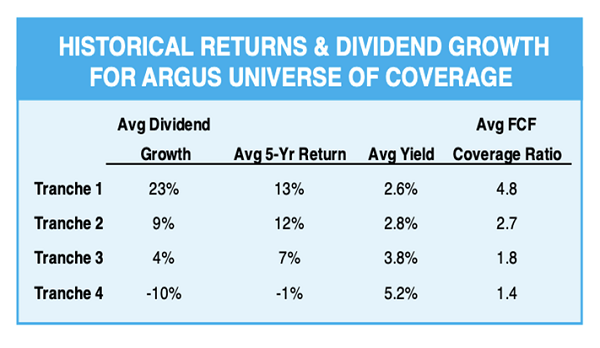
Argus examined the recent performance of the roughly 500 stocks that make up the “Argus Universe of Coverage,” then reduced that list to 400 by excluding stocks that haven’t paid dividends over the past five years. They then cut the list into four different groups based on their dividend growth over the five-year period.
“We found that the top two tranches—which each averaged close to or higher than double-digit dividend growth—delivered solid double-digit returns even though they did not have the highest average yields. Moreover, they had above-average cash-flow coverage ratios—a key financial strength measure. Tranche 4—with the lowest dividend growth—had the lowest returns, along with an above-average yield and a low FCF coverage ratio.”
Source: Argus Research
Look at how much that little table tells us. Sure, you sacrifice some current yield by investing in the fastest dividend growers. But there are a lot of losers among the high nominal yielders that weigh heavily on total returns.
And check out the dividend safety. It’s not just that you’re getting strong total returns, but the fastest dividend growers’ payouts are covered by nearly five times the cash they need, versus by just 1.4x for the high-yield group.
The message is clear: Keep your eyes and ears open for firms that really open up their wallets, and chances are you’ll find a few winners that are just screaming to be scooped up.
Let’s put a few recent massive raisers to the Argus test.
1. Abbott Laboratories (NYSE:ABT)
-
Dividend Yield: 3.3%
We’ll begin with Abbott Laboratories (NYSE:ABT), a medical devices, generic drugs and nutritional products maker that split with its pharmaceuticals business, AbbVie (NYSE:ABBV), in 2013. It’s best known in the income investing community for its status as a Dividend Aristocrat—one that has upped its payouts every year for nearly half a century.
ABT made a splash in December when it announced a 25% increase to its payout, to 45 cents per share. It’s the kind of outsized raise you rarely see among the S&P Aristocrats, especially those that are really far along in years. In fact, it was out of character for Abbott, whose more recent dividend hikes had been in the high single digits to low teens. Even including this raise, Abbott’s five-year dividend growth sits under 12%—not exactly in line with that first Argus tranche.
ABT Shares Will Have Another Big Dividend Hike to Chase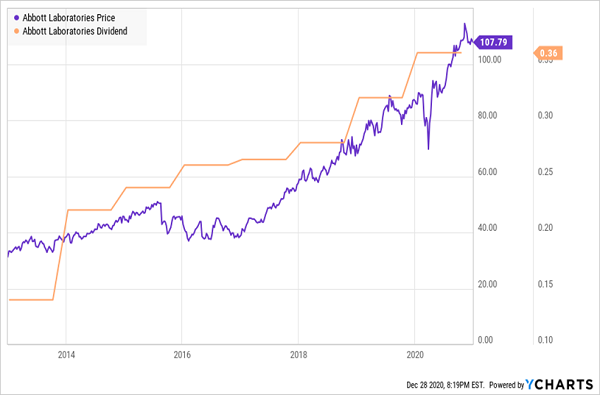
Abbott has certainly delivered the goods, however. Shareholders have enjoyed 20%-plus average annual returns over the past half-decade, and Wall Street is expecting another big year for ABT’s operations, modeling 14% revenue growth and 24% profit growth in 2021.
My two big concerns? Valuation is one—in addition to a modest 1.7% yield that’s in line with the broader market, the company trades at a price/earnings-to-growth ratio of 3.4. For those not familiar with PEG, it’s based around the number 1. Anything less than 1 implies the stock is undervalued, anything over 1 implies it’s overvalued. A multiple of 3.4 is certainly rich.
Also, Abbott’s free cash flow (FCF) coverage ratio was 1.4 before the hike. That means it had about 140% of the free cash flow it needed to cover the dividend, which is well below the 4.8 FCF coverage ratio of Argus’s first-tranche stocks. That doesn’t have me worried about the dividend’s safety, but it does make me doubt ABT’s ability to keep up a dividend-growth rate anywhere near the 25% it gifted shareholders in December.
2. Broadcom
-
Dividend Yield: 3.3%
Broadcom (NASDAQ:AVGO) is a semiconductor designer and manufacturer whose products are used heavily in communications and connectivity—networking, datacenters, broadband and wireless technology, and more. Its current scale is the result of the 2016 mega-merger between the old Broadcom and Avago Technologies, as well as subsequent acquisitions of CA Technologies and Symantec’s enterprise security arm.
This is a far different company than it was five years ago. Revenues were $6.8 billion during the fiscal year ended November 2015; over the past 12 months, the company has generated a top line of nearly $24 billion. While profits have been all over the board in that time, the broader trend has been up, and that has helped drive a nearly 33% annual return over the past five years.
Going forward, a driving factor behind the stock should be 5G technology, which already has helped its semiconductor solutions division post its first positive comps in two years. Continued growth in the datacenter should also boost AVGO’s fortunes.
So should its rapid dividend growth. The company’s five-year annual dividend growth rate of 52% might raise your expectations too high; the company’s most recent raise, of about 11%, is far more realistic.
And Oh, Does AVGO Have Some “Catching Up” To Do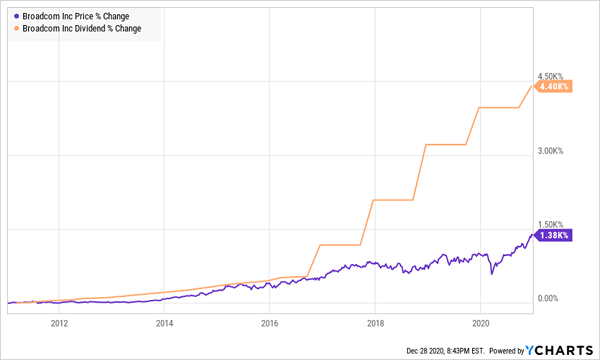
And here, we can have faith that AVGO can keep it up; that’s because despite the company’s lust for M&A, Broadcom generates more than enough cash to dole out to shareholders. Its FCF coverage ratio is a spectacular 4.1, meaning it has more than enough headroom to maintain its generosity and allow your “yield on cost” to swell over time.
You’ll need it, given AVGO’s current fractional yield.
3. Mastercard
-
Dividend Yield: 0.5%
Mastercard (NYSE:MA) has for decades been at the forefront of payments technology, even if we never really realized it. Credit cards might seem like old hat to us, but in many parts of the world, cash is still king. As recently as 2018, 87% of transactions in Spain were in cash; that figure was 86% in Italy, and amazingly, 82% in tech-savvy Japan.
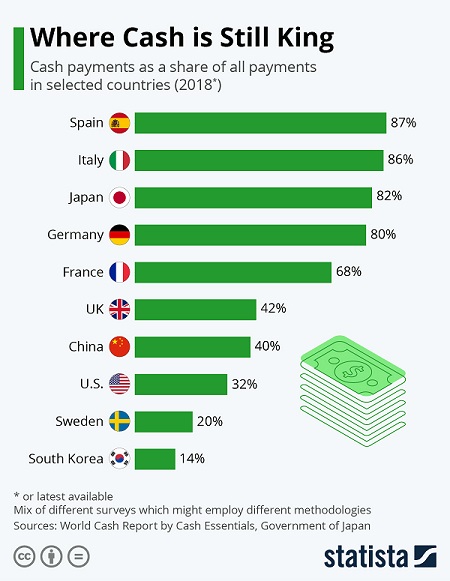
Source: Statista
In other words, Mastercard has a lot more runway in cashless transactions than you might think.
I’m also not talking just plastic—Mastercard knows that digital currencies, not credit cards, could be the future, and it’s already developing technologies to ensure it’s relevant there, too. In September, for instance, MA rolled out a testing platform that “allows central banks to evaluate use cases and test roll-out strategies for CBDCs.”
Regardless of what happens well down the road, Wall Street’s “smart money” still sees good things for MA nearer-term, projecting 19% top-line growth and a 30% bottom-line recovery in 2021, which could very well help Mastercard shares keep rolling at their nearly 29% annual rate from the past five years.
Mastercard’s Shares (And Dividends) Are Charging Ahead Full-Speed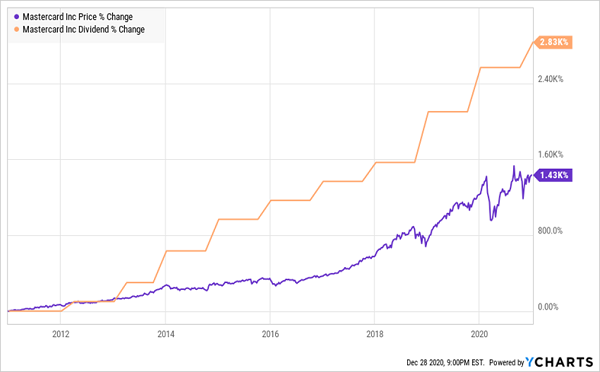
Where things get really exciting, though, is the income potential. I know, I know—you can get 0.5% from a high-yield savings account. But consider this: MA has been upping its payout by 18.3% a year for half a decade now, including a 10% raise in 2020. And it’s barely leaning on the spigot. Mastercard has 8 times the cash it needs to finance the payout at current levels, and that doesn’t account for any future gains it makes in cash generation.
If value is important, maybe wait for a broader market drop to whittle away some of the froth. Mastercard shares have bloated to 40 times future profit estimates, and a PEG of 2.0, which is elevated enough to give some investors pause.
Disclosure: Brett Owens and Michael Foster are contrarian income investors who look for undervalued stocks/funds across the U.S. markets. Click here to learn how to profit from their strategies in the latest report, "7 Great Dividend Growth Stocks for a Secure Retirement."
