By Jesse Colombo, Money Metals Exchange
Just two months ago, the precious metals community was growing frustrated with gold after its choppy, lukewarm summer price action. At that time, I kept urging investors to stay patient as I believed that gold was about to break out in multiple non-U.S. currencies, which would result in a powerful surge.
Sure enough, that's exactly what unfolded, and I believe even more gains are ahead. Now, I'm noticing the same frustration with silver, as it has remained stagnant for the past five months.
In this article, my goal is to encourage investors to remain patient with silver, as I believe it's on the verge of a strong breakout, much like gold—once these key conditions are met.
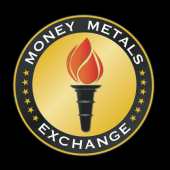
The first condition is straightforward yet largely overlooked by investors and has proven surprisingly challenging to achieve: the spot price of silver must close decisively above its $32.50 resistance level, backed by strong trading volume.
The $32.50 resistance level was established at the May high, after which silver pulled back and remained stagnant over the summer. Silver recently attempted to break above that level on September 26th and October 4th, but both efforts fell short, leading to subsequent pullbacks.
I believe the time is approaching, however, when silver will finally break through and close above that level, sparking a significant rally. Once that happens, I expect silver to surge rapidly to approximately $50.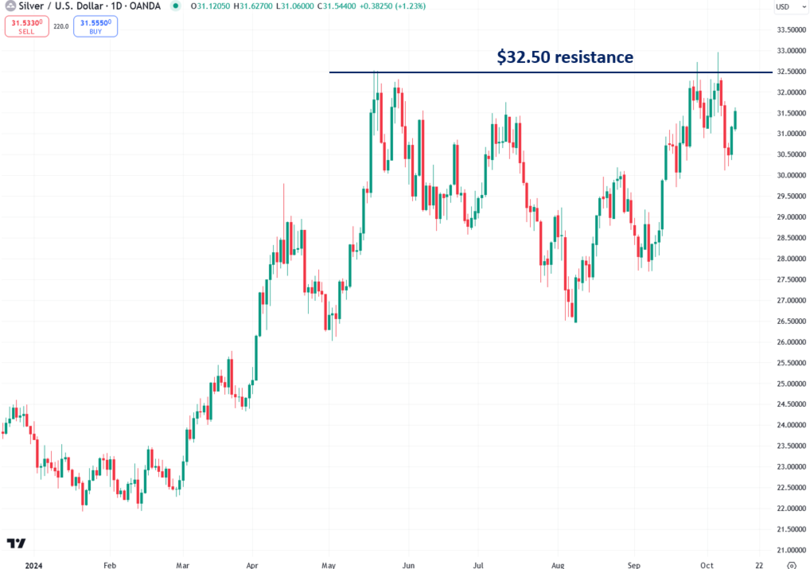
The next condition is that silver, priced in euros, must close decisively above the €30 resistance level that formed at the May peak. This event would help confirm a close above $32.50, greatly reducing the chances of it being a false breakout.
I find it valuable to analyze silver priced in euros, as this approach removes the impact of U.S. dollar fluctuations, offering a clearer view of silver's intrinsic strength or weakness. Notably, silver priced in euros often respects round numbers like €26, €27, and €28, frequently establishing key support and resistance levels at these points. These levels are worth watching closely—take a look for yourself.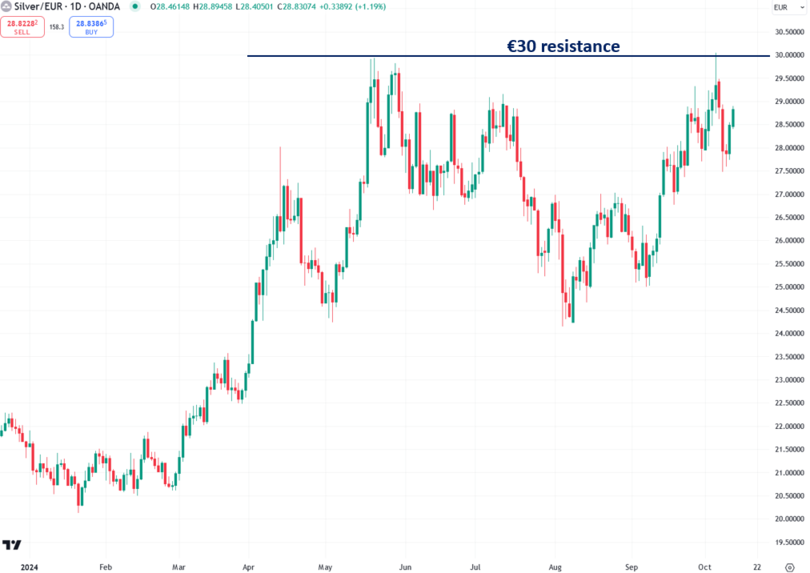
The final condition is more esoteric, but I believe it will significantly reduce the likelihood of an upcoming silver breakout being a false one: an index I developed, called the Synthetic Silver Price Index, must close above its key resistance zone between 2,560 and 2,640. This index represents the average of gold and copper prices, with copper's price adjusted (multiplied by 540) to prevent gold's higher price from disproportionately influencing the index (to learn more about this methodology, please watch a presentation I created).
The price of copper is an often overlooked factor in silver's performance and rivals the influence of gold. The index closely mirrors silver's price movements, yet surprisingly, silver’s price itself isn’t even an input!
As I said earlier in this piece, there is a high probability that silver will quickly run to $50 once those three conditions are met. I'm focusing on $50 as a relatively short-term target because it’s a significant psychological level and the peak reached during both the 1980 and 2011 rallies.
One of the reasons why I’m so bullish on silver is because its monthly chart reveals a recent breakout from a massive, two-decade-long triangle pattern. This breakout signals that silver is on the verge of a powerful bull market: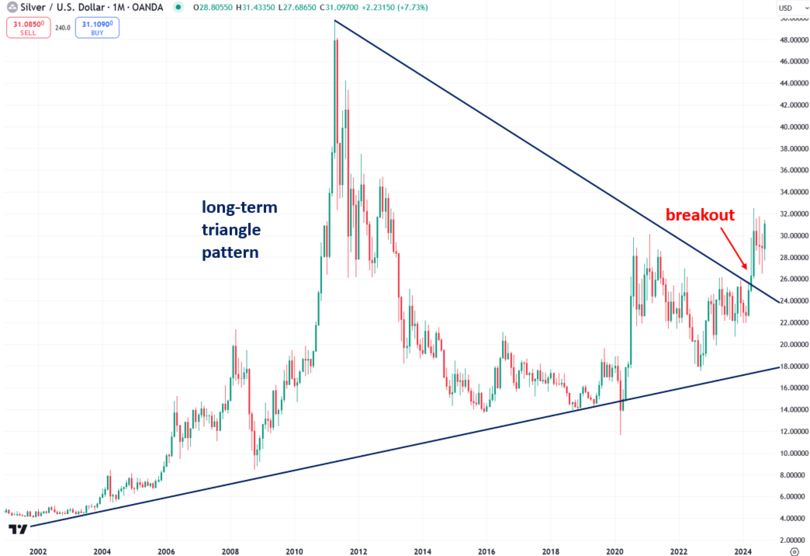
If that isn’t exciting enough, silver’s logarithmic chart, dating back to the 1960s, reveals a cup and handle pattern that suggests silver could reach several hundred dollars per ounce during this bull market. However, a close above the $50 resistance is necessary to confirm this scenario.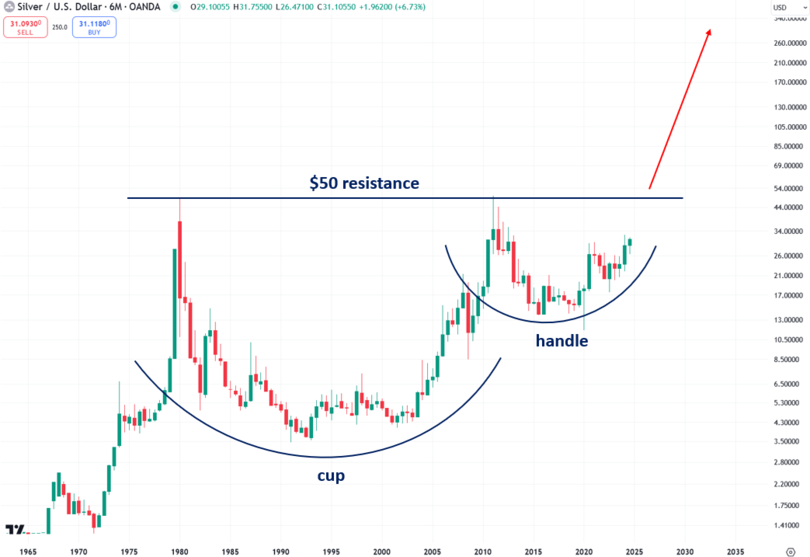
Although silver has already surged nearly 50% this year, there are plenty of reasons to believe it is just getting started. One reason is that the long-term gold-to-silver ratio chart shows silver is currently significantly undervalued compared to gold. If the ratio were to revert to its historical average of 52.8 since 1915, even without any increase in gold’s price, silver would be valued at a solid $50.36 per ounce.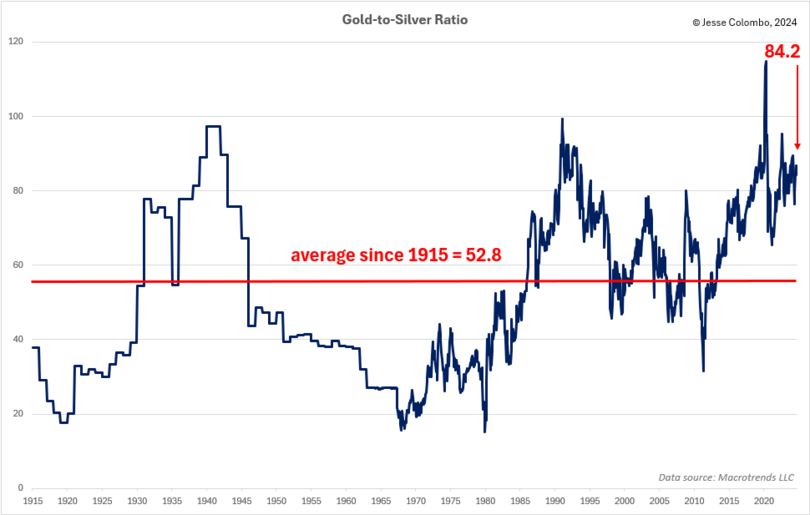
Adjusting silver’s price for inflation further highlights how undervalued it is by historical standards. During the Hunt brothers-induced spike in 1980, silver reached an inflation-adjusted price of $143.54. In the 2011 bull market, driven by quantitative easing, it hit $68.04. Currently trading at just $31.60, silver has significant room to rise if it’s to catch up with these previous inflation-adjusted peaks.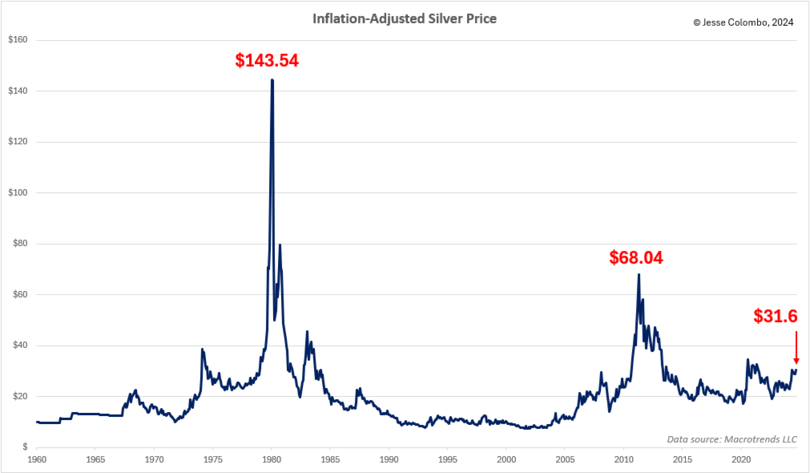
Another way to assess whether silver is undervalued or overvalued is by comparing it to various money supply measures. The chart below shows the ratio of silver’s price to the U.S. M2 money supply, providing insight into whether silver is keeping pace with, outpacing, or lagging behind money supply growth.
If silver’s price significantly outpaces money supply growth, the likelihood of a strong correction increases. Conversely, if silver lags behind money supply growth, it suggests a potential period of strength ahead. Since the mid-2010s, silver has slightly lagged behind M2 growth, which, combined with other factors discussed in this piece, could position it for a strong rally.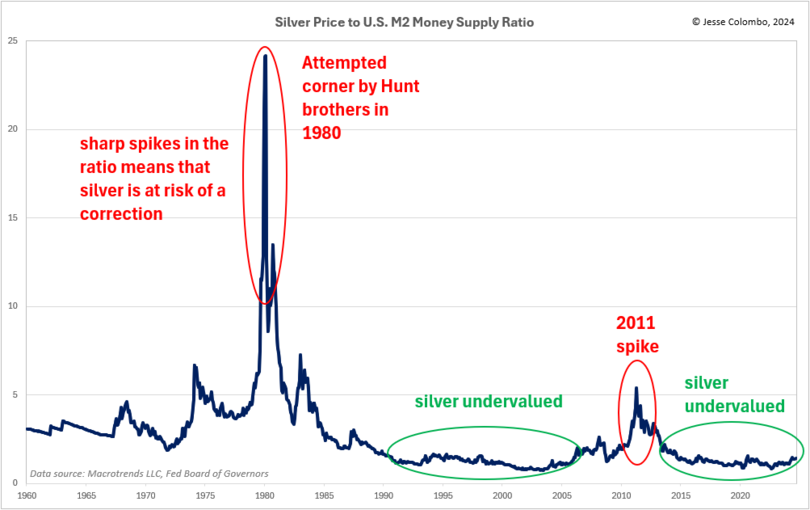
To summarize, silver is on the launch pad, building up energy for a significant breakout. While investor frustration is understandable after months of stagnation, the technical and fundamental indicators suggest that silver is building momentum for an impressive move.
The combination of breaking key resistance levels, both in U.S. dollars and euros, along with confirmation from the Synthetic Silver Price Index, will signal that the rally has officially begun. With historical trends and undervaluation further supporting this outlook, silver could be on the verge of a major run toward $50 and beyond.
Also, watch the related video presentation I created: